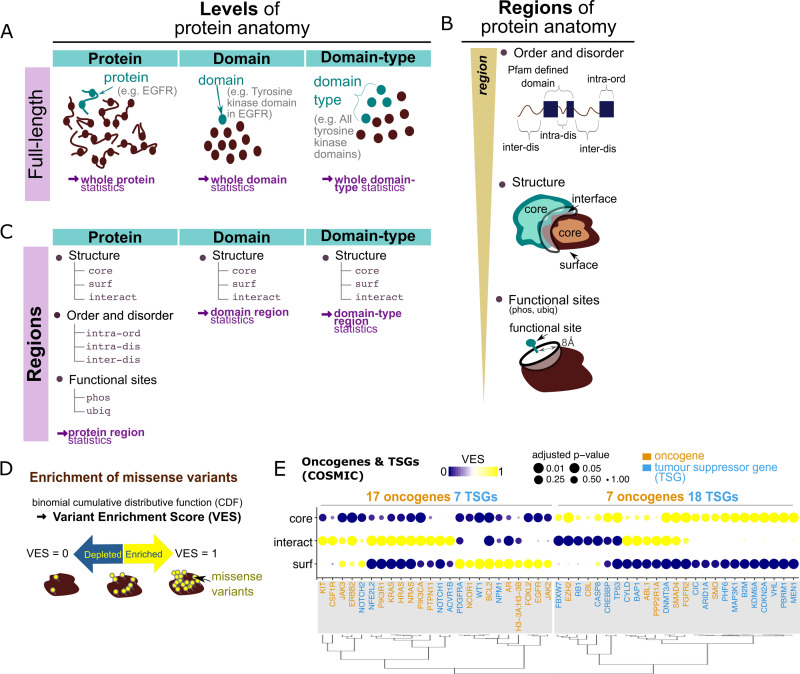
Fig 1. Variant enrichment crossing scales of protein anatomy.
(A) Levels of the protein anatomy. At the protein/domain level, the number of missense variants in a protein or domain is compared to the number of missense variants in the whole dataset which localise to defined proteins/domains. At the domain-type level, the number of missense variants in a particular Pfam defined domain-type is compared to the total number of missense variants which localise to any Pfam domain-type. These calculations are referred to as the “full-length” protein/domain/domain-type variant enrichment in this manuscript, in contrast with the calculations at regions of protein anatomy defined next. (B) Regions of the protein anatomy. We considered different levels of definition of protein regions, including (i) regions close to functional (phosphorylation/ubiquitination) sites; (ii) structural regions (core, surface [surf], and interface [interact]) of a protein; and (iii) regions predicted to be ordered or disordered which lie either within or outside of Pfam-defined domains. (C) Lists of regions considered at each level of the protein anatomy in this study. (D) The calculation of enrichment at the different levels is statistically assessed using the binomial distribution. The binomial cumulative distributive function constitutes a VES with value range 0 to 1, which quantifies enrichment. (E) Enrichment of COSMIC missense variants in protein core, surface, and interface regions, across a list of annotated oncogene (orange annotations next to the dendrogram) and TSG (blue) products. Size of points denote the level of statistical significance for the calculated VES. The genes were grouped into 2 clusters using hierarchical clustering over the VES statistics (clusters highlighted by grey rectangles; also see dendrogram); the number of oncogenes and TSGs in each cluster is noted. VES statistics can be readily browsed on the online ZoomVar web application. CDF, cumulative distributive function; EGFR, epidermal growth factor receptor; TSG, tumour suppressor gene; VES, Variant Enrichment Score.

