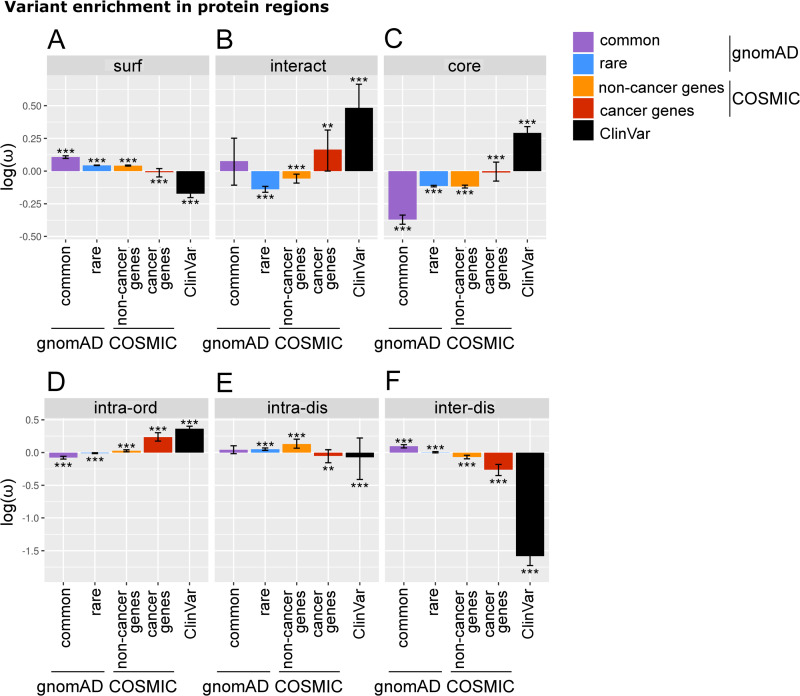
Fig 2. The localisation of variants to protein regions.
(A–C) The density of mutations in different protein regions, calculated using Eq 1. Density values (ω) were log-transformed such that negative values indicate a depletion of missense variants, while positive values indicate enrichment. Error bars depict 95% confidence intervals obtained from bootstrapping. Significance was calculated by comparison to simulated missense variant distributions (significance level indicated by: * q-value < 0.05, ** q-value < 0.001, *** q-value < 0.0001). Note here the COSMIC set is split into cancer genes (i.e., mutations mapping to proteins found in the COSMIC CGC) and noncancer gene subsets. Data are shown for protein surface (surf, panel A), interacting interface (interact, B), and core (C). (D–F) Density of mutations analogous to panels (A–C) but in regions defined by order and disorder. Data are shown here for intra-domain ordered (intra-ord, panel D), intra-domain disordered (intra-dis, E), and inter-domain disordered (inter-dis, F) regions. See S2 Data for the underlying data. CGC, Cancer Gene Census.

