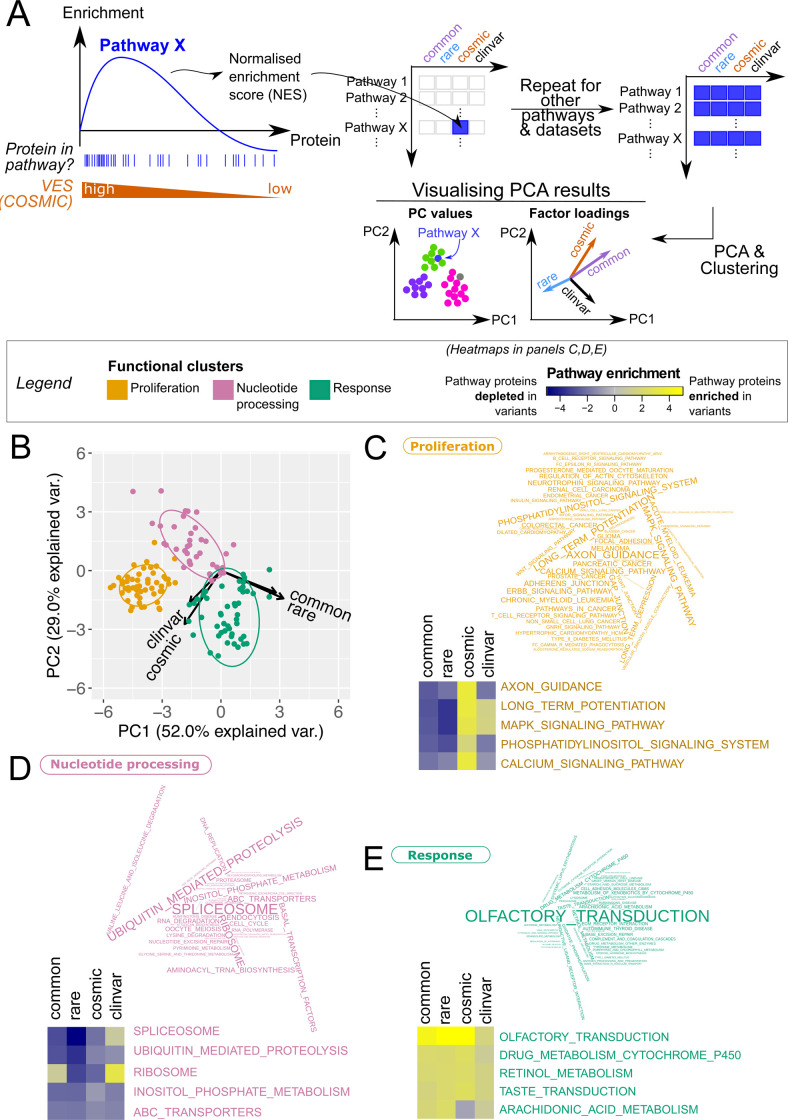
Fig 4. Pathway clusters defined according to protein-wise variant enrichment.
(A) Schematic of GSEA. GSEA was performed over lists of proteins ranked by VES; here, enrichment over a pathway X for COSMIC variants were illustrated. The process was repeated over all KEGG pathways and the resulting NES matrix was subject to PCA and clustering analyses. (B) At the whole protein level, KEGG pathways form 3 clusters (k-means), here visualised as projected onto the first 2 principal components of the PCA. Pathway enrichment patterns are clearly distinct between COSMIC, ClinVar, and gnomAD (rare/common) data, as evidenced by the visualisation of factor loadings (arrows). See S5 Fig for projection onto 3 principal components. (C–E) Pathway terms visualised for the “proliferation” (C), “nucleotide processing” (D), and “response” (E) clusters, and sized by their cluster uniqueness score. The latter is defined as the average of the Euclidean distances to the two other cluster centres. For the top 5 unique pathway terms for each cluster, their pathway enrichment scores calculated with the 4 variant sets are also visualised in a heatmap. S7 Data contains the full list of KEGG terms mapped to these clusters. See S6 Data for the enrichment scores. GSEA, Gene Set Enrichment Analysis; KEGG, Kyoto Encyclopedia of Genes and Genomes; NES, normalised enrichment score; PCA, Principal Component Analysis; VES, Variant Enrichment Score.

