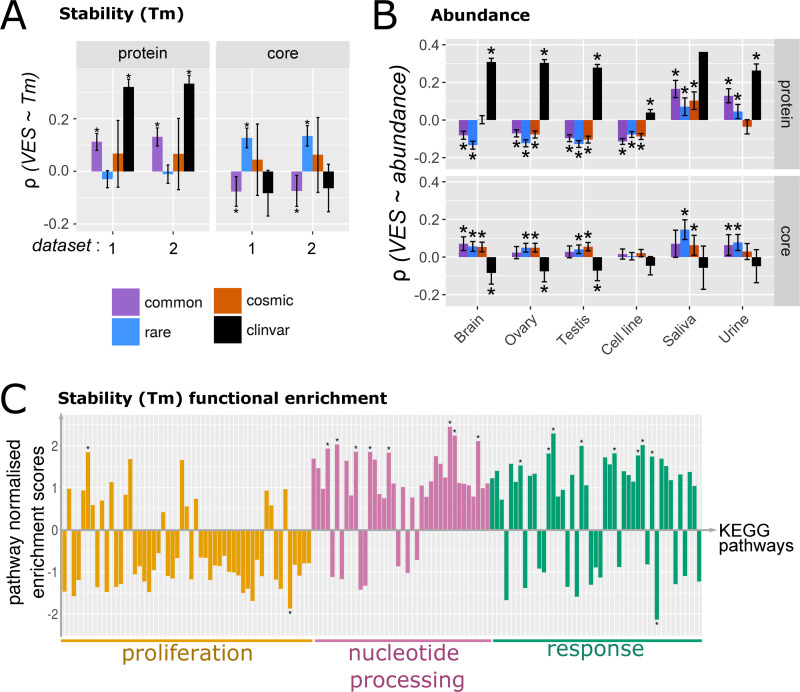
Fig 5. The protein-wise enrichment of missense variants in comparison to protein abundance, expression, and stability.
Spearman correlations for missense variant enrichment (quantified as VESs) at the full-length protein and the core with (A) protein stability in terms of melting temperature (Tm, °C) and (B) protein abundance (ppm) are depicted here. For (A), the Tm data was taken from epmid26379230, in which 2 measurements of Tm in the absence of any drug treatment were available; both measurements are considered and are denoted datasets “1” and “2” in the plot. For (B), only data from selected tissue types are listed. See S7 Fig for the complete list. S9 Data contains the underlying data. (C) Functional enrichment of proteins in KEGG pathways according to Tm. The NES for each pathway is shown on the vertical axis. KEGG pathways are listed on the horizontal axis and grouped to the 3 clusters as defined in Fig 4. See S11 Fig for a complete list of pathways depicted here. S10 Data contains the underlying data. KEGG, Kyoto Encyclopedia of Genes and Genomes; NES, Normalised Enrichment Score; Tm, melting temperature; VES, Variant Enrichment Score.

