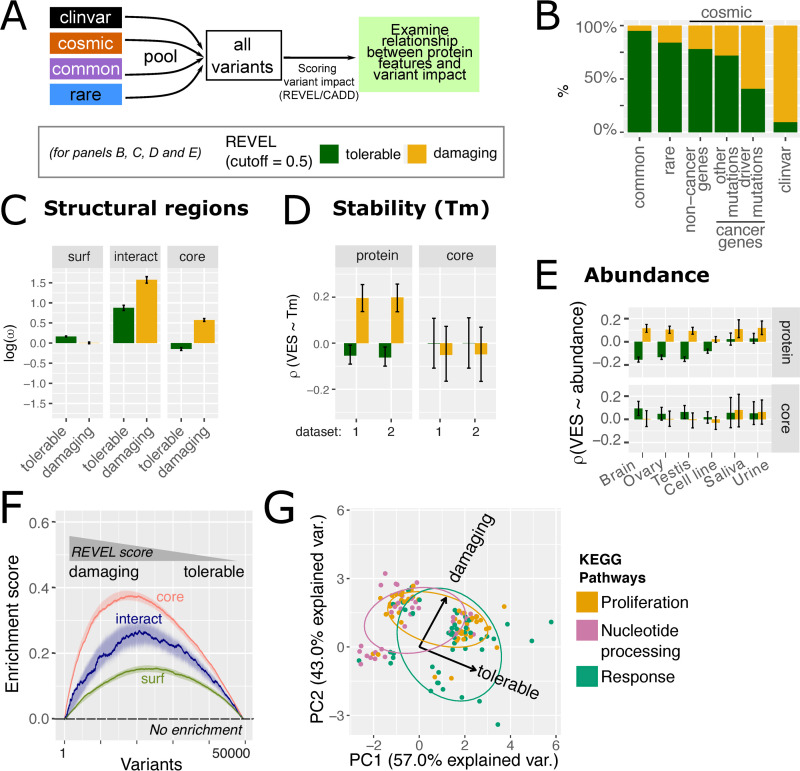
Fig 7. Orthogonal variant impact predictions validate structural and proteomics features.
(A) Schematic of pooling variants and annotating variant impact. (B) Breakdown of variant impact classified by REVEL in the variant datasets. For COSMIC variants in cancer genes, variants were segregated depending on whether they are driver mutations (curated in IntoGen [50], version 2016.5). (C) The enrichment of tolerable and damaging variants in different protein structural regions. Variants are annotated using REVEL. The bars represented the median density (ω, here taken logarithm such that negative values indicate depletion and positive values indicate enrichment) of 1,000 bootstrapped samples, each a subset of 50,000 variants. The error bars represented 95% confidence intervals from such bootstrapping. See S16 Fig for analogous results for CADD. (D–E) The correlation between VES calculated at the whole-protein level (“whole”) and the protein core, with protein stability (panel D, melting temperature or Tm) and abundance (E). Identical to Fig 5 but with the “tolerable” and “damaging” classification under REVEL score. See S17 and S18 Figs for data on CADD, and plots for all tissues represented in the abundance dataset. (F) The enrichment of surface, core, and interacting interface over variants ranked by REVEL score. The enrichment score from the GSEA procedure was plotted here. The absence of enrichment would result in a flat line at 0 (dashed black line). Curves represent data from 1 representative bootstrapped sample; the ribbons indicate 95% bootstrapped confidence intervals. (G) Pathway enrichment analysis for tolerable and damaging variants as defined by REVEL, i.e., underlying data identical to that of panels (B–D). Here, pathway enrichment scores were projected on 2 principal components analogous to Figs 4B and 6. Pathways were categorised using the scheme defined in Fig 4B. See S19 Fig for analogous results for CADD. S13 Data contains underlying data for all panels of this figure. GSEA, Gene Set Enrichment Analysis; Tm, melting temperature; VES, Variant Enrichment Score.

