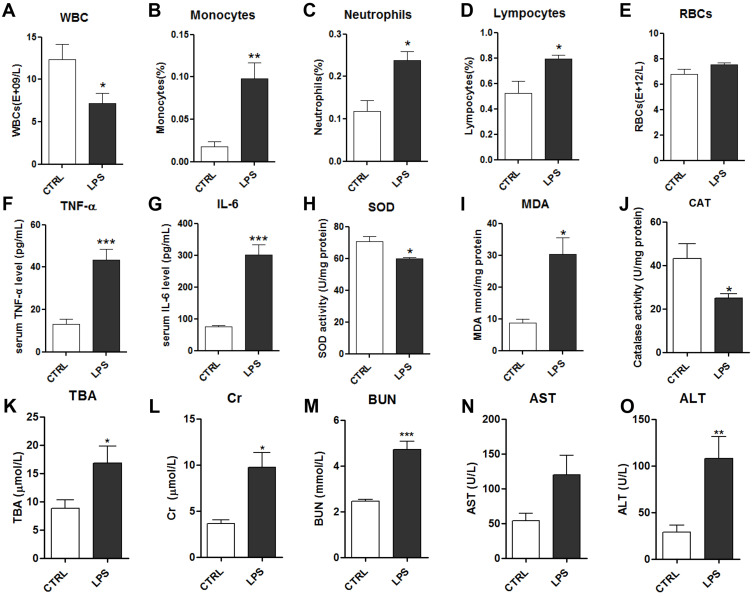
Figure 2.
Effects of LPS on serum biochemical indicators: white blood cells (WBCs) (A), monocytes (B), neutrophils (C), lymphocytes (D) and red blood cells (RBCs) (E); serum levels of TNF-α (F) and IL-6 (G); serum levels of the oxidative stress factors superoxide dismutase (SOD) (H), malondialdehyde (MDA) (I), and catalase (CAT) (J); and kidney and liver function indicators: total bile acids (TBA) (K), creatine (Cr) (L), blood urea nitrogen (BUN) (M), aspartate transaminase (AST) (N) and alanine transaminase (ALT) (O).
Notes: Data are expressed as mean ± SEM (n=10 per group). *p<0.05, **p<0.01, ***p<0.001 vs control group.

