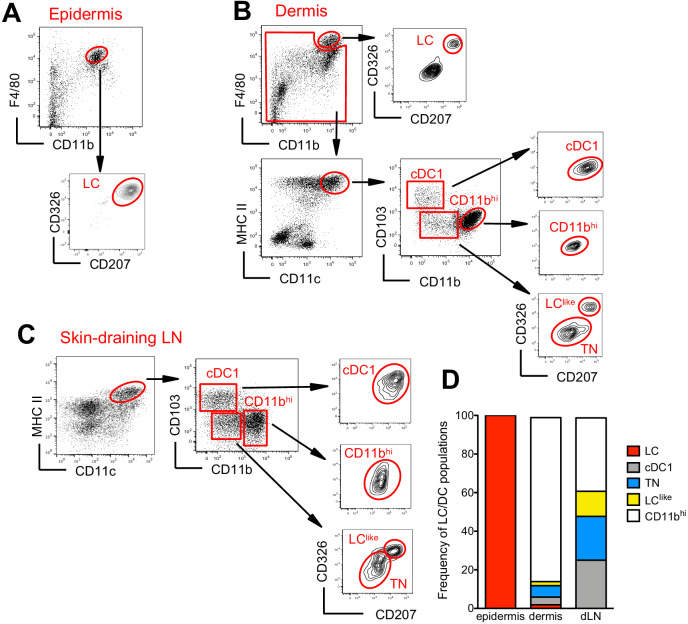
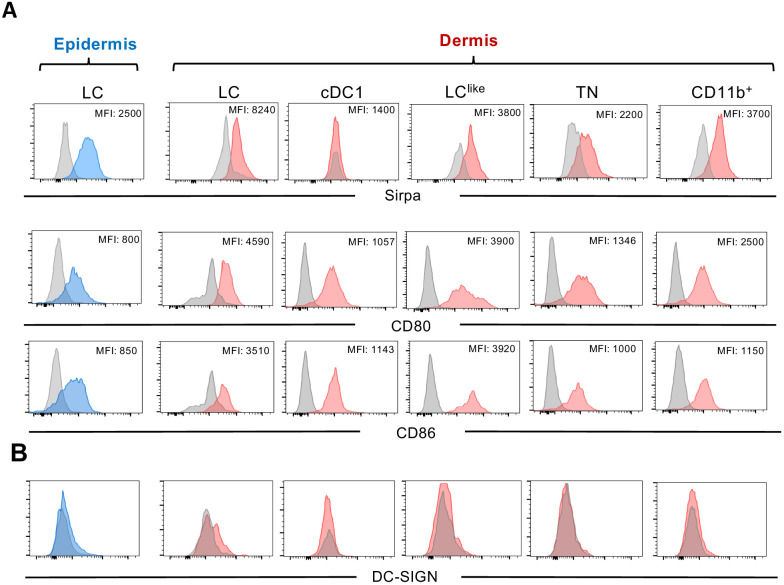
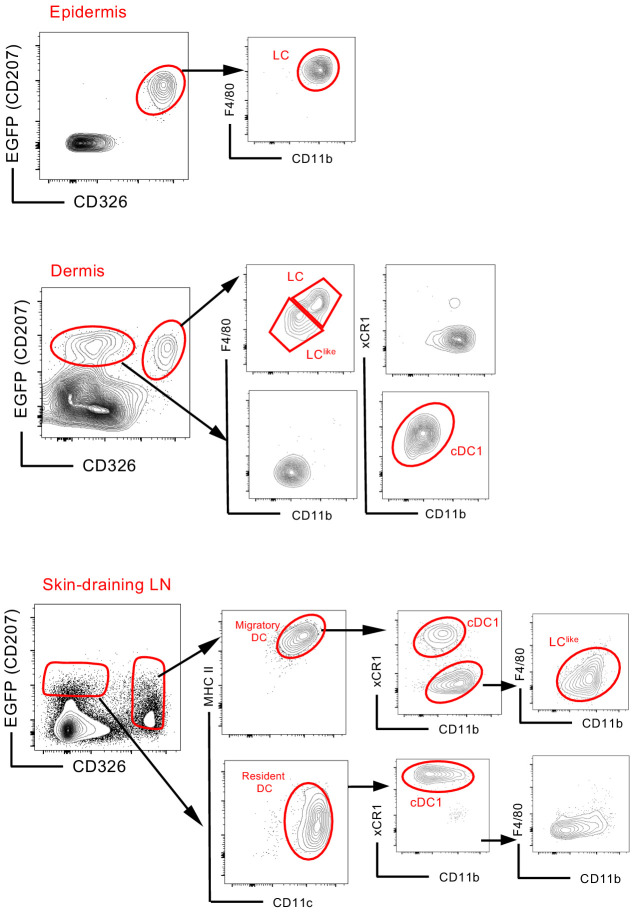
Figure 1. Characterization of cutaneous Langerhans cell (LC) and dendritic cell (DC) subpopulations.
(A) Representative flow cytometry dot plots for LC characterization in the epidermis. Cells from epidermis were first gated for FSC, SSC, and CD45 (not shown). Then, CD45+ cells were analysed for CD11b and F4/80 expression. The CD11bhiF4/80hi cell fraction was further analysed for CD207 and CD326 expression to identify classical bona fide LCs. (B) Representative flow cytometry dot plots for dermal LC and DC subpopulations. Isolated dermis cells were first gated for FSC, SSC, and CD45 (not shown). CD45+ cells were then analysed for CD11b and F4/80 expression. The CD11bhi F4/80hi fraction contained classical CD207+CD326+ LCs. The remaining cells were gated for CD11c+MHC II+ DCs and separated into three subsets based on CD103 and CD11b expression: CD103+CD11b- cells (labelled cDC1), CD103-CD11bhi DCs (labelled CD11bhi), and CD11blow/neg. CD207 and CD326 expression was detectable on cDC1 but not CD11bhi DCs, whereas CD11blow cells were further separated into CD207-CD326- (labelled triple negative [TN]) and CD207+CD326+ (labelled LClike). (C) Representative flow cytometry dot plots for cutaneous DC subpopulations in auricular skin-draining LNs. LN cells were first gated for FSC and SSC to exclude small lymphocytes before F4/80 and CD11b staining. The cell fraction excluding F4/80hi/CD11bhi cells was separated by CD11c and MHCII. CD11chiMHCIIhi migratory DCs were gated and analysed for CD103, CD11b, CD207, and CD326 expression. Four subsets were detected: CD103+CD11b-CD207+CD326+ (cDC1), CD103-CD11blowCD207-CD326- (TN), CD103-CD11blowCD207+CD326+ (LClike), and CD103-CD11bhiCD207-CD326-/+(CD11bhi). (D) Frequency of each DC subpopulation (LC, cDC1, LClike, TN, and CD11bhi) present in epidermis, dermis, and cutaneous lymph node (LN), respectively.


