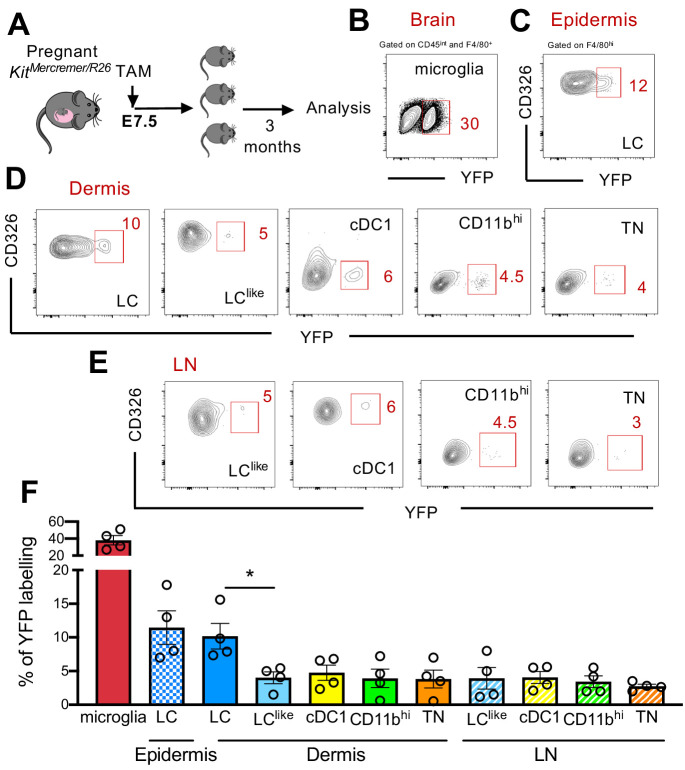
Figure 4. Distinct embryonic origin between Langerhans cell (LC) and LClike cells.
(A) Single pulse of TAM at E7.5 was given to label KitMercreMer/R26 embryos and the percentages of labelled brain microglia (positive control, gated on CD45intF4/80hi), epidermal LCs, and dermal LC/dendritic cell (DC) subpopulations were measured at 3 months of age. (B–D) Flow cytometry analysis of YFP labelling of microglia (B), and each LC and DC subpopulation in the epidermis (C), dermis (D), and lymph node (LN) (E) in KitMerCreMer/R26 fate mapping mice. Representative contour plots are shown. (F) The mean percentage of YFP+ cells of brain microglia, epidermal LC, and dermal DC subpopulations (LC, cDC1, LClike, CD11bhi, and triple negative [TN] cells). The error bars represent the SEM (n = 4 samples of two to three pooled mice for epidermis/dermis and n = 5 mice for LN). Data from two independent experiments. *p<0.05; two-way ANOVA followed by Bonferroni test. For clarity, non-significant values are not shown.

