. 2021 Apr 8;10:e60691. doi: 10.7554/eLife.60691

Figure 3. Kcnk5b induces Lef-1-dependent transcription in several tissues in a cell autonomous manner.

(A) Diagram of transplantation procedure and possible cell-autonomous and non-cell-autonomous outcomes on the expression of the Tg[7XTCF-Xla.sam:mCherry] Lef1 reporter after heat-shock induction of the Tg[hsp70:kcnk5b-GFP] transgene. (B) Transplantation experiments of donor cells from double transgenic fish harboring Tg[hsp70:kcnk5b-GFP] and Tg[7XTCF-Xla.sam:mCherry] into homozygous host embryos harboring only the Tg[7XTCF-Xla.sam:mCherry]. The head (a) eye (e) trunk (i) and finfold (m) of mosaic larva before heat shock induction of kcnk5b-GFP expression. Head (b–d), eye (f–h), trunk (j–l), and finfold (n–p) of 72 dpf larva at 24 hr after heat shock. (C) Bright field images of the head (a,d), jaw area (g) border tissue of otic vesicle (j) and trunk (o,r) of 72 hpf larva; GFP expression from Tg[hsp70:kcnk5b-GFP](b,e,h,k,p,s) and mCherry expression from Tg[7XTCF-Xla.sam:mCherry] (c,f,i,l,q,t). (D) Higher magnification of merged (a) and separate GFP (b) and mCherry (c) channels of cells in the neural tube of 48 hpf embryos. Z-stack composite three-dimensional images before rotation (d), rotated 90° (e) and 180° (f). (E) Total number of positive cells counted in the tissues of all mosaic larva for all mCherry-positive cells from recipient Tg[7XTCF-Xla.sam:mCherry] larva, all GFP-positive cells from Tg[hsp70:kcnk5b-GFP](open green triangle) and all double positive cells (open blue squares). The data for each experiment represent three or more experiments with two or more biological replicates. Scale bars are equal to 200 μm (Ba-l), 50 μm (Bm-p), 20 μm (C), and 25 μm (D).

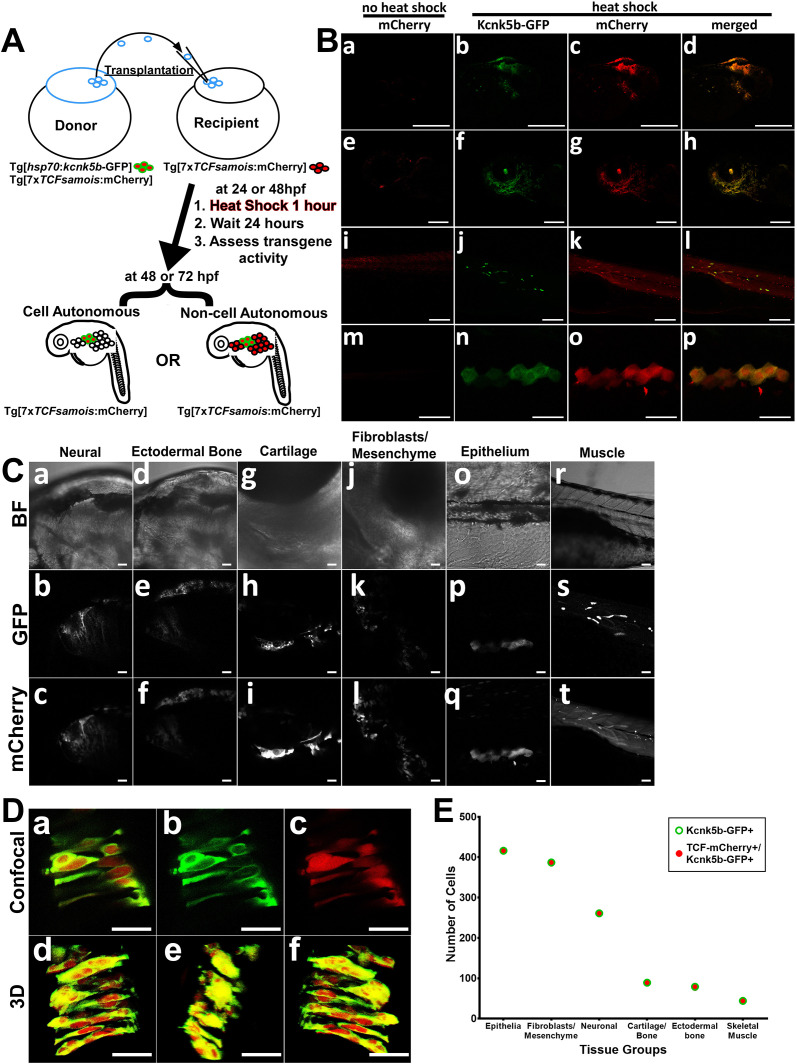
Figure 3—source data 1. Counting Results of cells expressing the mCherry Lef-1 reporter and GFP-labelled Kcnk5b transgene.

Figure 3.

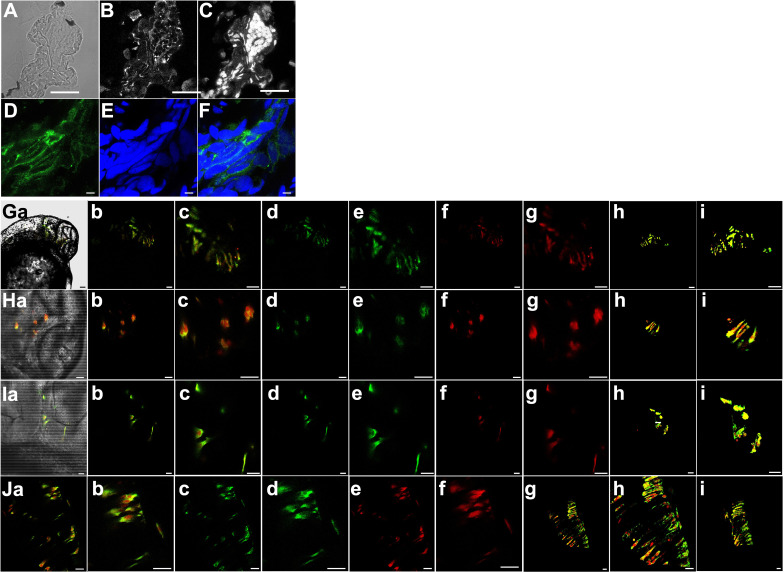
Figure 3—figure supplement 1. Expression of Kcnk5b-GFP from Tg[hsp70:kcnk5b-GFP] after single heat shock and consequent activation of 7XTCF-Xla.sam:mCherry.

Figure 3—figure supplement 1.

(A) Representative bright field cross-section through the mid-section of heat-shocked transgenic zebrafish 72 hpf larva. (B) Immunohistochemical staining for GFP of the same cross section in panel A. (C) DAPI staining of the same cross-section in panel A. (D) Representative confocal image of immunohistochemical staining for GFP in heat-shocked transgenic zebrafish larva showing membranous staining of Kcnk5b-GFP. (E) DAPI staining of the same confocal section in panel D. (F) Merged image of panels D and E. (Ga–i) Images of cells in the head 48 hpf embryos expressing kcnk5b-GFP transgene and mCherry from the 7XTCF-Xla.sam:mCherry transgene. (a) Bright fish image, (b) Merge of GFP and mCherry, (c) enlargement of (b), (d) GFP image, (e) enlargement of (d), (f) mCherry image, (g) enlargement of (f), (h) 3D composite of z-stacked images, (i) enlargement of (h). (Ha–i) Images of cells in the brain of 48 hpf embryos expressing kcnk5b-GFP transgene and mCherry from the 7XTCF-Xla.sam:mCherry transgene. (a) Bright fish image, (b) Merge of GFP and mCherry, (c) enlargement of (b), (d) GFP image, (e) enlargement of (d), (f) mCherry image, (g) enlargement of (f), (h) 3D composite of z-stacked images, (i) enlargement of (h). (Ia–i) Images of cells in the developing otic vesical of 48 hpf embryos expressing kcnk5b-GFP transgene and mCherry from the 7XTCF-Xla.sam:mCherry transgene. (a) Bright fish image, (b) Merge of GFP and mCherry, (c) enlargement of (b), (d) GFP image, (e) enlargement of (d), (f) mCherry image, (g) enlargement of (f), (h) 3D composite of z-stacked images, (i) enlargement of (h). (Ja–i) Images of cells in the developing neural tube of 48 hpf embryos expressing kcnk5b-GFP transgene and mCherry from the 7XTCF-Xla.sam:mCherry transgene. (a) Merge of GFP and mCherry, (b) enlargement of (a), (c) eGFP image, (d) enlargement of GFP image (c), (e) mCherry image, (f) enlargement of mCherry image (e), (g) 3D composite of z-stacked images, (h) enlargement of 3D composite (g), (i) 90° rotation of 3D composite of z-stacked images (g). Scale bars equal 40 µm (A–C), 5 µm (D–F), 20 μm (G–J). The data for each panel represents three or more experiments.