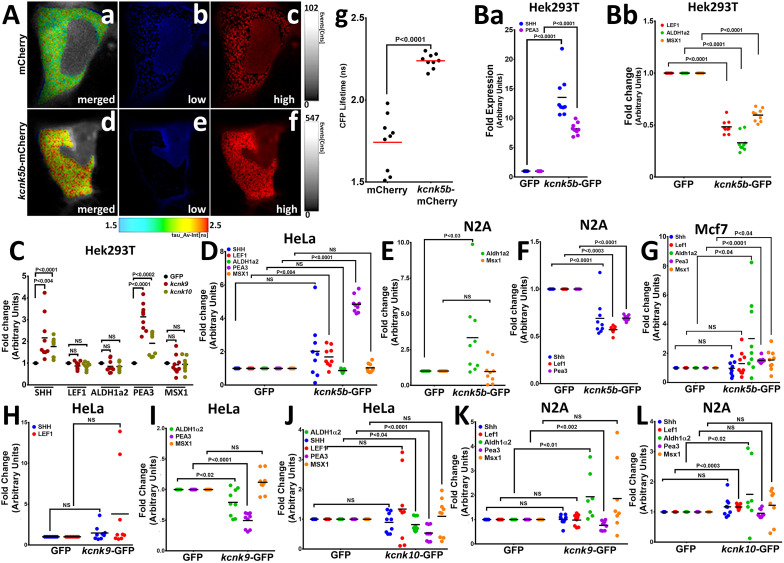
Figure 4. Kcnk5b channel activity regulates developmental gene transcription in mammalian cells.
(A) FRET-FLIM images after measuring the life time of CFP of the K+ FRET reporter KIRIN (Shen et al., 2019). The color images indicate the differences in CFP fluorescence lifetime of the K+ FRET reporter KIRIN in HEK293T (HEK) cells. Assigned rainbow of colors in the delineated cytoplasm depict the range of numeric values of nanoseconds (ns) of the detected fluorescent lifetime for CFP. Red represents longer lifetime values. Blue represents shorter lifetime values, and the other colors represent intermediary lifetime values. (a) Composite image of all lifetime values of the KIRIN K+ reporter in control cells transfected with mCherry. (b) Image of low lifetime values in a control cell. (c) Image of high lifetime values in a control cell. (d) Composite image of all lifetime values of the KIRIN K+ reporter in cells expressing kcnk5b-mCherry. (e) Image of low lifetime values in cells expressing kcnk5b-mCherry. (f) Image of high lifetime values in cells expressing kcnk5b-mCherry. (g) Compared to GFP-transfected HEK cells, cells transfected with kcnk5b-mCherry show an increase in CFP lifetime due to reduction in intracellular K+. (Ba) qRT-PCR for SHH and LEF1 in HEK cells. (Bb) qRT-PCR for ALDH1a2, PEA3 and MSX1 in HEK cells. (C) qRT-PCR for indicated genes in HEK cells expressing GFP, kcnk9-GFP or kcnk10-GFP 24 hr after transfection. (D) qRT-PCR results in HeLa cells expressing either GFP or kcnk5b-GFP 24 hr after transfection. (E,F) qRT-PCR results in N2A cells expressing either GFP or kcnk5b-GFP 24 hr after transfection. (G) qRT-PCR results in Mcf7 cells expressing either GFP or kcnk5b-GFP 24 hr after transfection. (H,I) qRT-PCR measurement of indicated gene after 24 hr transfection of Kcnk9 in Hela cells. (J) qRT-PCR measurement of indicated gene after 24 hr transfection of Kcnk10 in HeLa cells. (K) qRT-PCR measurement of indicated gene after 24 hr transfection of Kcnk9 in N2A cells. (L) qRT-PCR measurement of indicated gene after 24 hr transfection of Kcnk10 in N2A cells. The data represent three or more experiments, The data points show all technical replicates. Student’s T-test was used for tests of significance and the levels of significance are indicated between the experimental groups.


