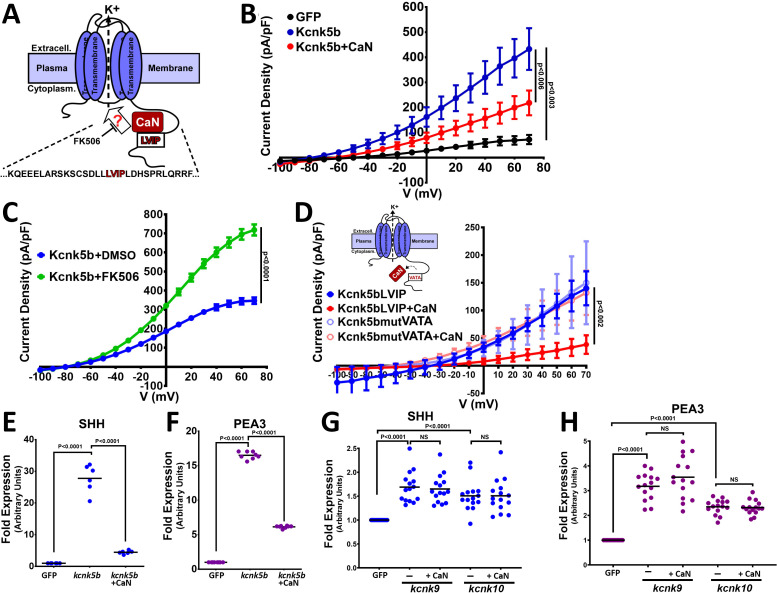
Figure 5. Calcineurin functionally interacts and regulates channel activity of Kcnk5b.
(A) Diagram of hypothetical interaction between Calcineurin (CaN) and Kcnk5b at a consensus calcineurin binding site (LVIP) in Kcnk5b. (B) Whole-cell patch clamp of HEK293T (HEK) cells expressing the indicated zebrafish proteins: Calcineurin-mCherry and Kcnk5b-GFP. (C) Whole-cell patch-clamp results of cells expressing zebrafish Kcnk5b-GFP and treated either with DMSO or the calcineurin inhibitor FK506. (D) Diagram shows mutant Kcnk5b with altered amino acids at putative calcineurin binding site and graph of the Patch-clamp results of the wild-type zebrafish Kcnk5b channel (Kcnk5bLVIP) or mutant Kcnk5b (Kcnk5bmutVATA) lacking the putative calcineurin binding site. Each construct is expressed either with or without calcineurin (CaN). (E) qRT-PCR for SHH in HEK cell lines stably expressing either GFP or Kcnk5b-GFP and transfection with calcineurin-mCherry (CaN). (F) qRT-PCR for PEA3 in HEK cell lines stably expressing either GFP or Kcnk5b-GFP and transfection with calcineurin-mCherry (CaN). (G) qRT-PCR of SHH expression HEK cells after transfection either with GFP, kcnk9-GFP or kcnk10-GFP with or without calcineurin (CaN). (H) qRT-PCR of PEA3 expression HEK cells after transfection either with GFP, kcnk9-GFP, or kcnk10-GFP with or without calcineurin (CaN). The electrophysiology measurements (B–D) are averages with SEM. (E–G) Graph panels show averages. The data represent three or more experiments. The averaged data points graphed in D-B have two or more technical replicates per experiment. The data points graphed in E-H show all technical replicates. Student’s T test was used to determine the indicated significance (p) values.

