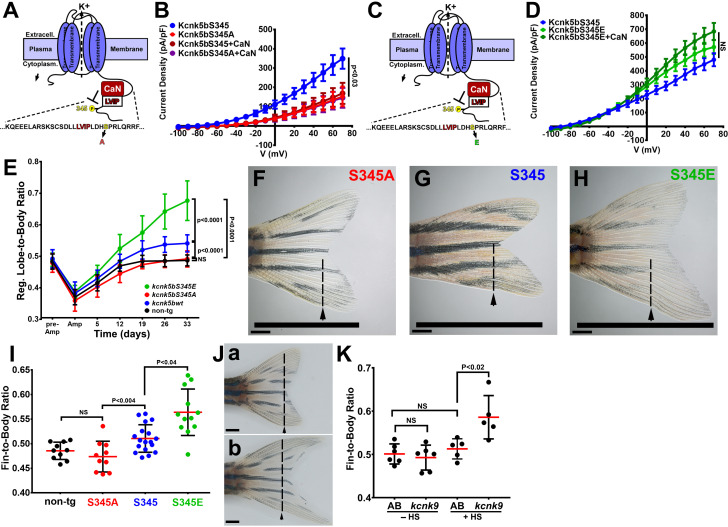
Figure 6. Regulation of Kcnk5b controls scaling of the fin.
(A) Diagram of Kcnk5b channel showing proposed Serine345Proline346 calcineurin dephosphorylation site adjacent the calcineurin-interaction site (LVIP). Mutation of S345 to alanine (A) mimics dephosphorylation. (B) Whole-cell patch-clamp results of HEK239T (HEK) cells transfected with zebrafish wild-type channel (Kcnk5bS345) or the dephospho-mimic mutant (KcnkS345A) either with or without calcineurin (CaN). (C) Diagram of serine (S) to glutamic acid (E) substitution to mimic phosphorylation of Kcnk5b. (D) Whole-cell patch-clamp measurements for wild-type Kcnk5b and mutant Kcnk5b harboring a Serine345 to glutamic acid either with or without calcineurin (CaN). (E) Graph displays different growth rates of the regenerating caudal fin lobes of the indicated transgenic fish lines. Body length of each fish was used to standardize the fin length measurements (fin-to-body ratio). (F) Caudal fin of Tg[hsp70:kcnkbS345A] transgenic fish after regeneration of ventral lobe. (G) Caudal fin of Tg[hsp70:kcnk5bS345] transgenic fish after regeneration of ventral lobe. (H) Caudal fin of Tg[hsp70:kcnk5bS345E] transgenic fish after regeneration of ventral lobe. (I) Graph of fin-to-body ratios of the unamputated lobes of the indicated transgenic fish lines at 33 days of the same fish as in (F). (J) Representative caudal fins of the Tg[hsp70:kcnk9-GFP] fish that was allowed to regenerate without any heat-shock induction of the transgene (a) or underwent a daily 10 min heat-shock induction of the Tg[hsp70:kcnk9-GFP] transgene (b). (K) Assessment of regenerative fin growth at 33 dpa of the indicated fish lines and heat-shock treatment. The data for each experiment represent three or more experiments. The averaged data points in B,D,E represent two or more technical replicates per experiment. The graphed data in I,K show all technical replicates. The electrophysiology measurements (panels B,D) are represented as averages with SEM. Significance values shown in the graphs were measured by students t-tests (E, I, K) are represented as averages and SD. The scale bars equal 2 mm (F–H,Ja,b). Arrows and dashed lines in F-H,Ja,b indicate amputation planes through fins.


