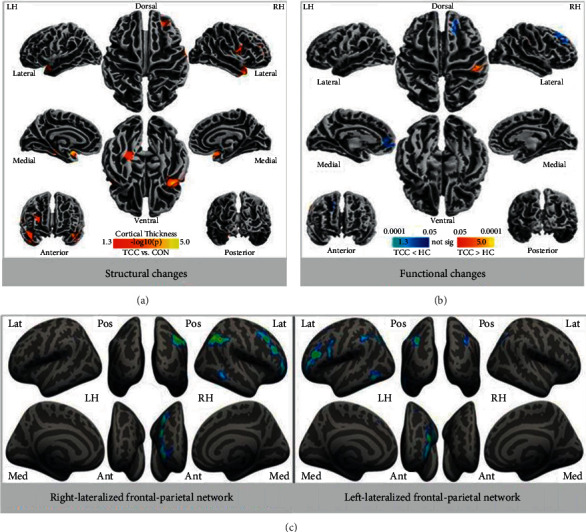
Figure 2.

An illustration of direct research evidence from brain imaging of the prefrontal cortex. (a) Structural changes: thicker cortical regions in the TCC group; (b) functional changes: functional homogeneity measured by 2dReHo in the TCC group compared to the control group (blue colors indicate decreases in 2dReHo, while red colors indicate increases in 2dReHo; (c) intrinsic connectivity network based on 12 brain networks, the left panel indicates the right-lateralized frontal-parietal network, while the right panel indicates the left-lateralized frontal-parietal network.
