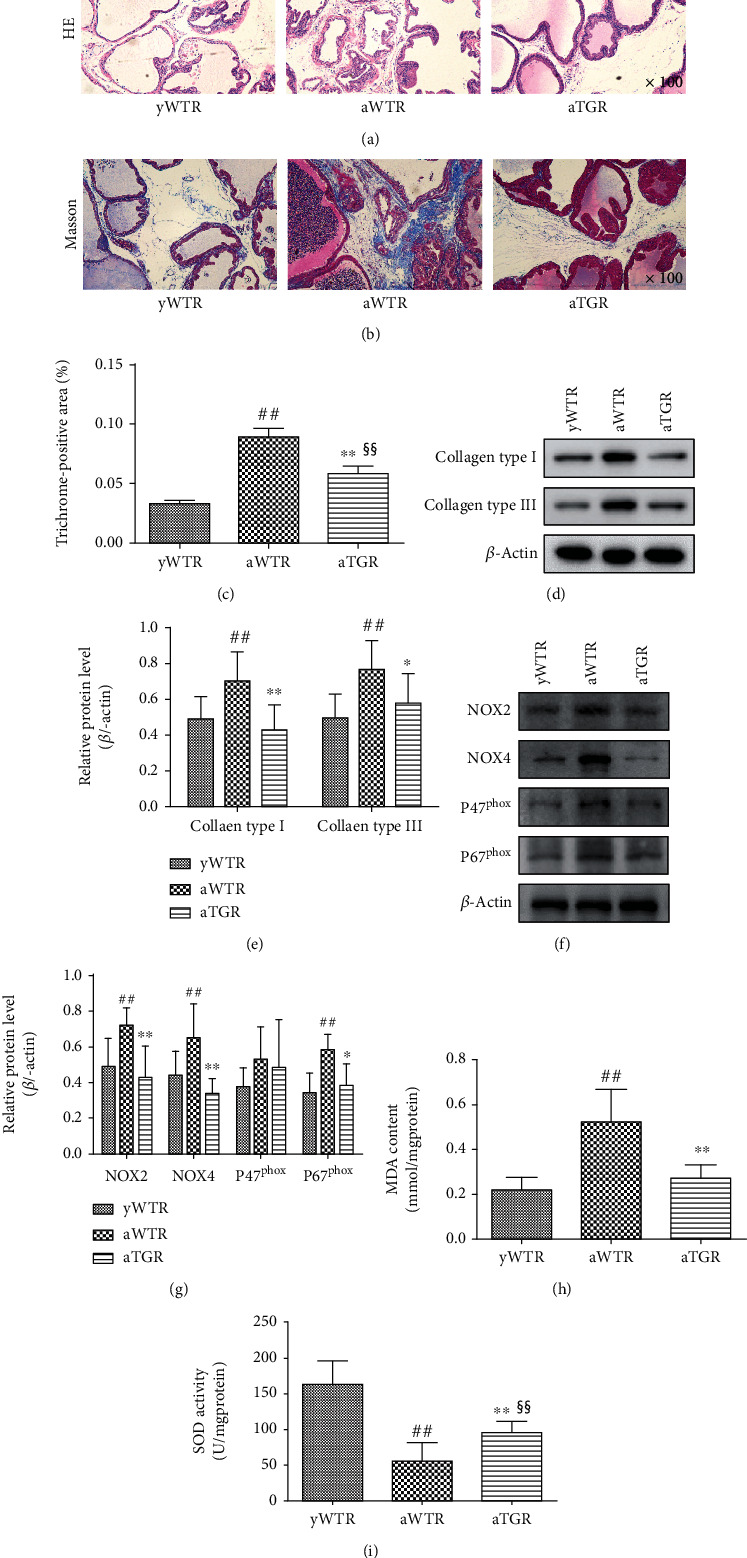
Figure 5.

Pathological changes and oxidative status of prostate in aged wild rats and aged human KLK1 transgenic rats. (a, b) Representative HE photos and Masson photos in rat prostates (magnification ×100). (c) The area ratio of collagen in the Masson photos of rat prostates. (d, f) Representative Western blot results of Collagen I, Collagen III, NOX2, NOX4, p47phox, and p67phox in prostates of all three groups. (e, g) The expression levels of above-mentioned proteins with β-actin as the loading control in all three groups. (h, i) MDA content and SOD activity normalized to total protein concentration of rat prostate samples. For each group, values are presented as the mean ± SD of 10 rats per group. ∗P < 0.05, ∗∗P < 0.01 (aTGR vs. aWTR). ##P < 0.01 (aWTR vs. yWTR). §§P < 0.01 (aTGR vs. yWTR).
