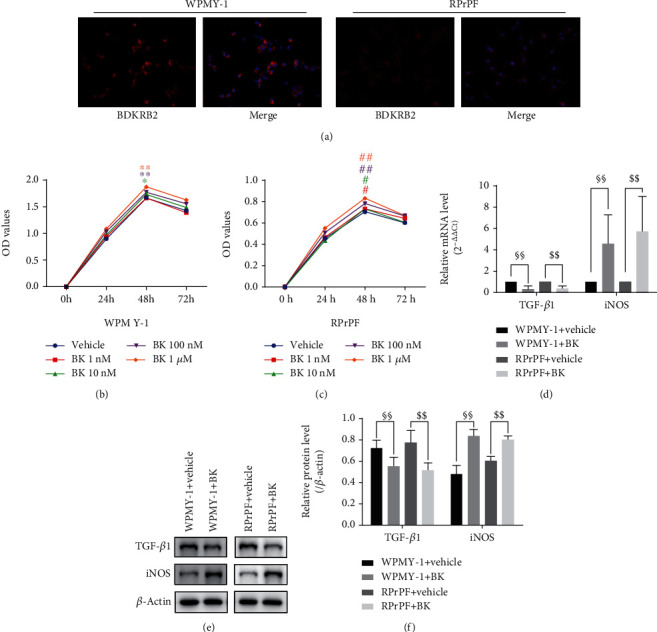
Figure 7.

The direct effects of BK on prostate cells. (a) The BDKRB2 (red) expression in WPMY-1 and RPrPF (magnification ×200). (b, c) MTT results of WPMY-1 and RPrPF under administration of BK in different concentrations. Results were plotted as OD values. ∗P < 0.05, ∗∗P < 0.01 (WPMY-1 + BK vs. the vehicle group at the same time point in 3 independent repeated experiment). #P < 0.05, ##P < 0.01 (RPrPF + BK vs. the vehicle group at the same time point in 3 independent repeated experiment). (d) Relative mRNA expression of the TGF-β1 and iNOS to β-actin within WPMY-1 and RPrPF under 10 nM BK by RT-PCR. (e, f) TGF-β1 and iNOS protein expression within WPMY-1 and RPrPF under 10 nM BK by Western blot. Each bar represents mean ± SD of 3 independent repeated experiment. §§P < 0.01 (WPMY-1 + BK vs. WPMY-1 + vehicle). $$P < 0.01 (RPrPF + BK vs. RPrPF + vehicle).
