. 2021 May 15;22(5):348–365. doi: 10.1631/jzus.B2000441

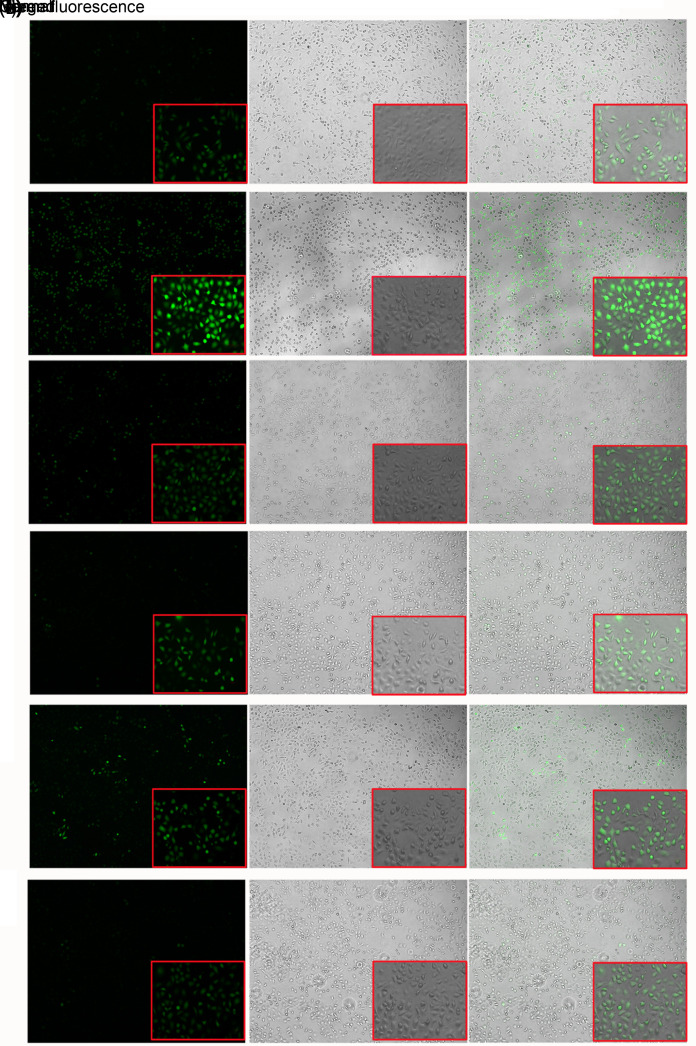
Fig. 6. Analysis of ROS levels in Hy-HUVEC cells with NC8-pSIP409-alr-ACEIP treatment. ROS generation in the control and Hy-HUVEC cells was assayed with DCFH-DA. Fluorescence intensity of the oxidation-insensitive probed DCF-DA in control and Hy-HUVEC cells was measured. Cells were examined under a fluorescence microscope. The large images and small images were observed under field of view of 5× and 20× magnifications (scale bar=100 μm), respectively. (a) Control group; (b) H2O2 positive control group; (c) NC8-alr group; (d) NC8-pSIP409-alr-ACEIP group; (e) NC8-alr+H2O2 group; (f) NC8-pSIP409-alr-ACEIP+H2O2 group. When ROS levels were increased in cells, the DCF signal was increased and the intensity of green fluorescence was enhanced. The intensity of the green fluorescence can be regarded as an indicator of ROS level. Hy-HUVEC: H2O2-induced human umbilical vein endothelial cell; ACEIP: angiotensin-converting enzyme inhibitory peptide; ROS: reactive oxygen species; DCFH-DA: 2',7'-dichlorofluorescein diacetate (no fluorescence); DCF-DA: 2',7'-dichlorofluorescein diacetate (with fluorescence) (Note: for interpretation of the references to color in this figure legend, the reader is referred to the web version of this article).

Fig. 6