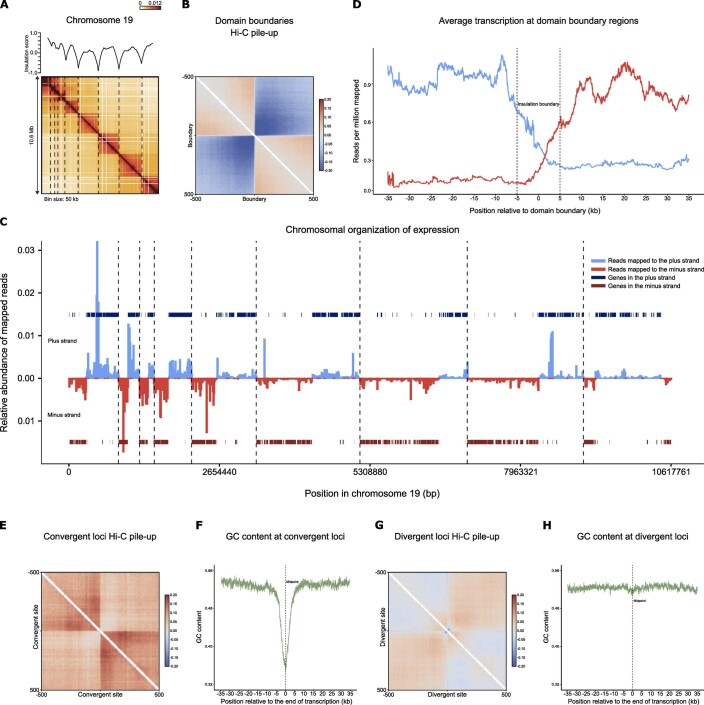
Extended Data Fig. 7. Correlation between Hi-C domains and unidirectional gene blocks for Smic1.1N.
a, Hi-C interaction map for chromosome 19 (Smic1.1 N; bin size = 50 kb) for mastigotes. Dotted lines indicate domain boundaries. Plot on top of the heatmap represents the insulation profile (10 kb resolution, window size 500 kb; see Methods). b, Average Hi-C interactions around the set of 468 domain boundaries at 10 kb resolution. c, Chromosome 19 transcription and domain landscape. Indicated are: transcripts mapping to the plus strand (light blue), transcripts mapping to the minus strand (red), genes on the plus strand (dark blue), genes on the minus strand (dark red), and domain boundaries as dotted vertical lines. A clear domainal gene block organization is observed and is delimited by Hi-C domain boundaries. Each domain is a pair of divergent gene blocks. Domain boundaries occur where gene blocks converge. d, Average relative transcription around boundaries. Values are averaged across all domain boundaries in the genome for regions 30 kb upstream and downstream domain boundaries and in 100 bp sliding windows. Dotted lines delimit domain boundary, which is a 10 kb region based on Hi-C data. The limited level of transcription that is observed to proceed through the boundary can be the result of the imprecision of boundary detection (10 kb). e, Hi-C pile-up plot for 213 manually curated convergent sites, previously not identified as domain boundaries, at 10 kb resolution. f, GC content around all convergent sites. Values are averaged across all manually curated convergent sites in the genome for regions 35 kb upstream and downstream to the midpoint between two expression blocks (dotted line) in 100 bp sliding windows. A sharp decline in GC content is observed at convergent regions. g, Hi-C pile-up plot for 358 manually curated divergent sites at 10 kb resolution. h, GC content around divergent sites. Values are averaged across all manually curated divergent sites in the genome for regions 35 kb upstream and downstream to the midpoint between two expression blocks (dotted line) in 100 bp sliding windows. Contrary to convergent sites, only a slight decline, if any, in GC content is observed at divergent sites.

