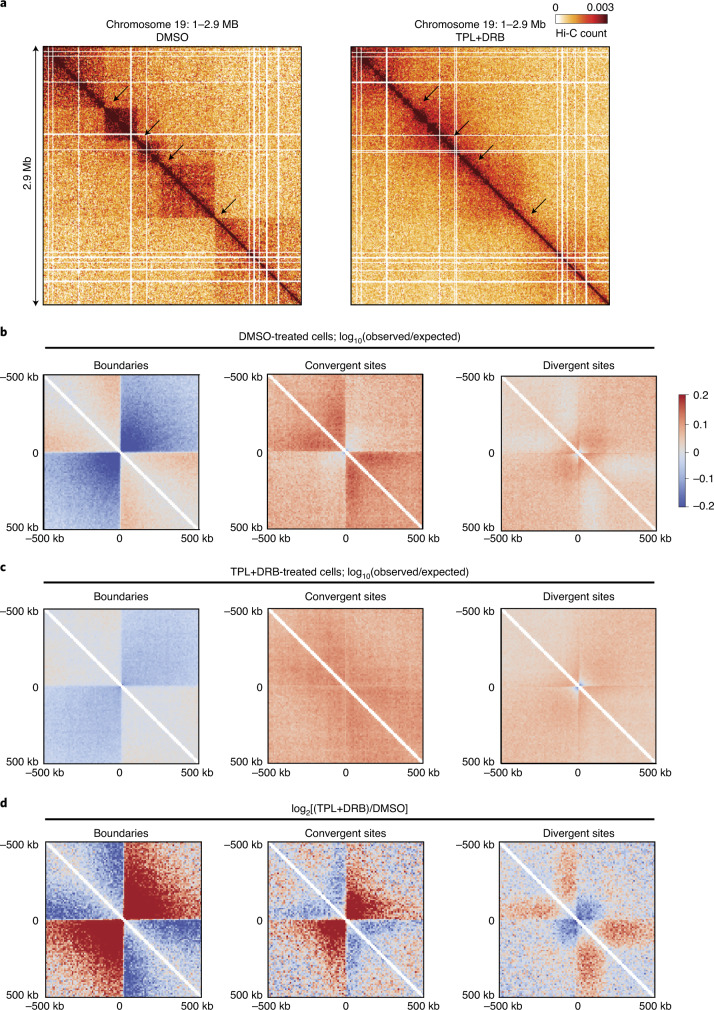
Fig. 6. Altered chromosome conformation in cells treated with triptolide and DRB.
a, Hi-C interaction maps for a section of chromosome 19 (Smic1.0; bins size 10 kb) for cells treated with DMSO (control, left) or triptolide (TRP) and DRB (right). Cells were treated with 25 μM TRP + 50 μM DRB or 200 μM TRP + 400 μM DRB. Both treatments produced similar results, and Hi-C data obtained with the two treatments were pooled. Arrows indicate positions of domain boundaries that are visible in control cells and that disappear in cells treated with triptolide and DRB. b, Hi-C data (observed/expected) for DMSO-treated cells, aggregated around domain boundaries (±500 kb; n = 441, left panel), convergent sites (n = 280; middle panel) and divergent sites (n = 517; right panel). Bin size: 10 kb. Data are log10(observed interaction frequency/expected interaction frequency). c, Hi-C data (observed/expected) for triptolide + DRB-treated cells, aggregated around domain boundaries (±500 kb; n = 441, left panel), convergent sites (n = 280; middle panel) and divergent sites (n = 517; right panel). Bin size: 10 kb. Data are log10(observed interaction frequency/expected interaction frequency). d, Change in chromatin interactions around domain boundaries (±500 kb; n = 441, left panel), convergent sites (n = 288; middle panel) and divergent sites (n = 517; right panel). Shown is log2[(TRP + DRB)/DMSO]. Bin size: 10 kb.

