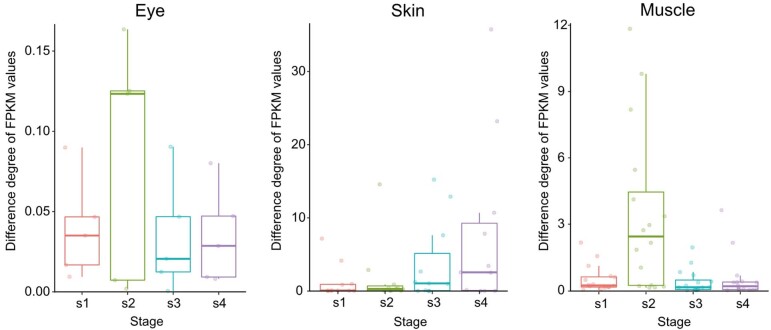
Extended Data Fig. 6. Asymmetric gene expression in metamorphic flounders.
The symbol s1-s4 in the x-axis represents the four developmental stages of flounder, including the pre-metamorphic stage, the pro-metamorphic stage, the metamorphic climax stage, and the post-metamorphic stage, respectively. The y-axis represents the gene expression difference across the left-right axis of flounder, as indicated by FPKM values. The minima, maxima, centre, and the upper and lower bounds of box represent the maximum, minimum, median value, upper and lower quartile, respectively. Each colored dot represents one gene in WNT, RA, or NODAL signal pathway, or gene that associated with pigmentation that are equivalent to those indicated in Fig. 4d in the main text.

