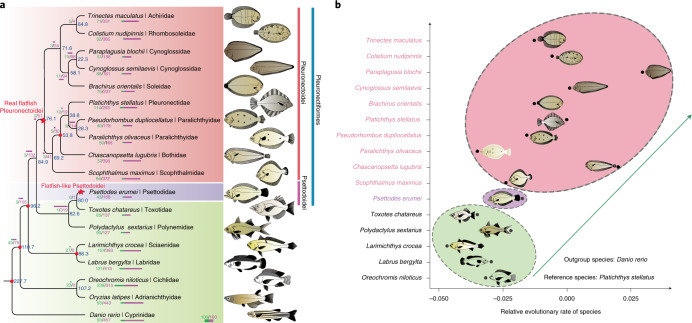
Fig. 2. Polyphyletic origin and fast genome evolution of flatfishes.
a, Phylogenetic relationship and divergence time among the flatfish species. The number in each node represents the divergence time among species and the red circle indicates the fossil record used for calibration in the node. The numbers with slashes, as well as the bars, represent the expanded and contracted gene families in this node, respectively. The silhouette image of each species was drawn according to their morphology using Adobe Illustrator software. b, Relative evolutionary rates of the flatfish species. Zebrafish was used as the outgroup and Platichthys stellatus as the reference species. The arrow represents the trend of the relative evolutionary rates. The colored ovals represent different fish groups that showed contrasted relative evolutionary rates.

