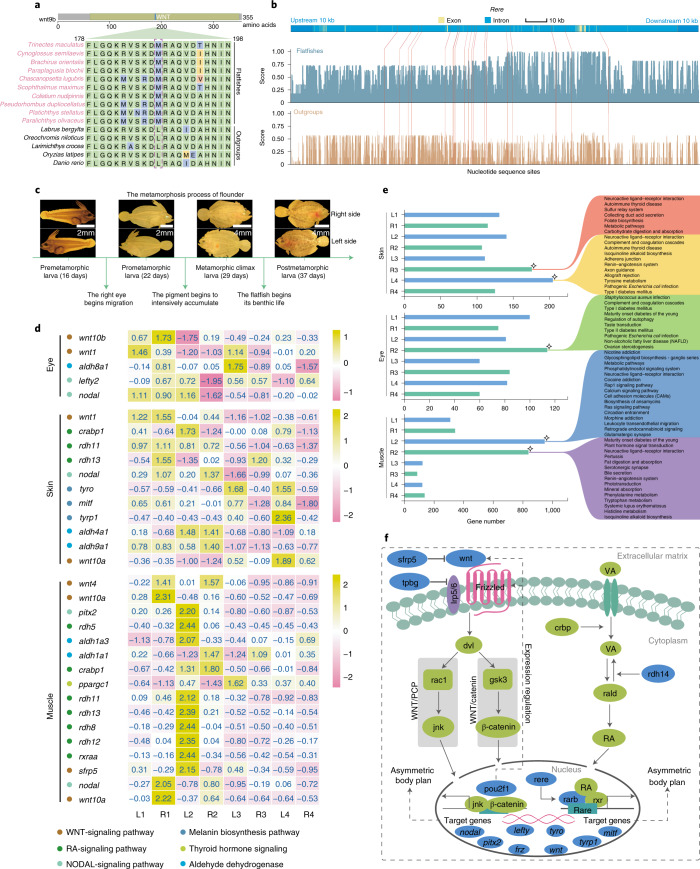
Fig. 4. Genetic changes associated with asymmetric body plan in flatfishes.
a, Mutations of wnt9b in RFP compared with outgroups. The diagram of protein structure is shown on the top of the graph, and the site that showed variation is marked with a dashed box. b, SCNEs nearby the rere gene. The x axis represents the nucleotide sequence sites across rere; the y axis represents sequence similarity scores. The blue and brown columns represent the average sequence similarity score within RFP and outgroups for each site, respectively; the red lines represent the physical locations of the SCNEs across the gene. c, Metamorphic process of flounder. Images of flatfish in premetamorphic stage, prometamorphic stage, metamorphic climax stage and postmetamorphic stage are shown. d, Left–right asymmetrical expression of genes in eye, skin and muscle tissues of metamorphic larvae of flounder. The numbers 1–4 on the x axis represent the four metamorphic stages of flounder. L and R on the x axis represent tissues on the left side and right side of the larva, respectively. e, Number of the specifically highly expressed genes during metamorphosis of flounder. The right diagram represents the biological processes in which these genes were involved. The rhombus symbols mark the stages during which the number of the genes began to show greatest expression changes. f, Hypothetical signaling pathway that may correlate to the body plan asymmetry in flatfishes. Proteins marked blue are those encoded by genes that experienced genetic alteration in RFP. Genes marked blue and italicized are regulating targets of these proteins and also exhibited abnormal expression (left–right asymmetry) during metamorphosis in RFP.

