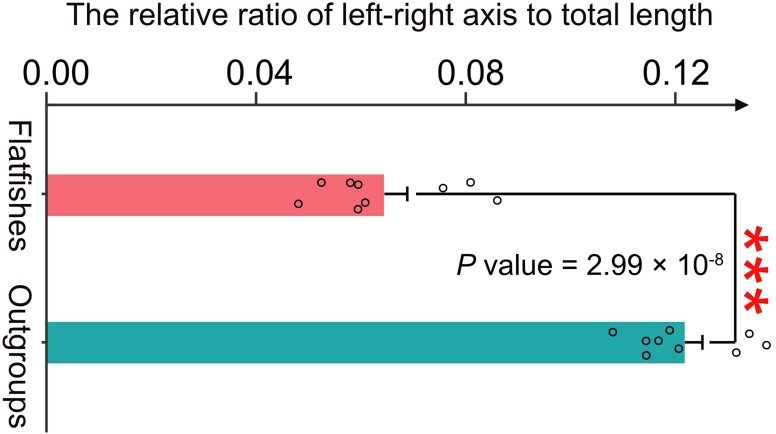
Extended Data Fig. 4. The relative ratio of left-right axis to total length.
The relative ratio of maximum length of left-right axis to the total length was used here to indicate the degree of body pan flatness of fishes. The ratio was measured in three individuals for each species and the data are presented as mean values ± SD. The statistical difference between groups was calculated using Student’s t-test (two tails) with ‘***’ representing a statistical significance of P value < 0.001.

