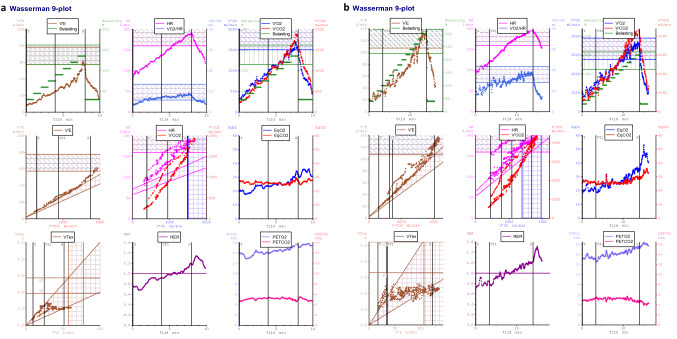
Fig. 3.
Wasserman 9-plot of the same two patients of Fig. 2. Panel a RERpeak 1.2, WRp 135 W (92% of the predicted value), HRpeak 187 bpm (99% of the predicted value), VO2peak 1616 ml/min (73% of the predicted value), VE 28.03, O2pulsemax 8.65 ml/bpm (68% of the predicted value). Panel b RERpeak 1.2, WRp 300 W (122% of the predicted value), HRpeak 196 bpm (107% of the predicted value), VO2peak 3564 ml/min (96% of the predicted value), VE 29.7, O2pulsemax 18.3 ml/bpm (90% of the predicted value). HRpeak maximal heart rate at peak exercise, O2pulsemax maximal O2 pulse, RERpeak respiratory exchange ratio at peak exercise, VO2peak oxygen uptake at peak exercise, VE ventilatory efficiency, WRpeak peak work rate

