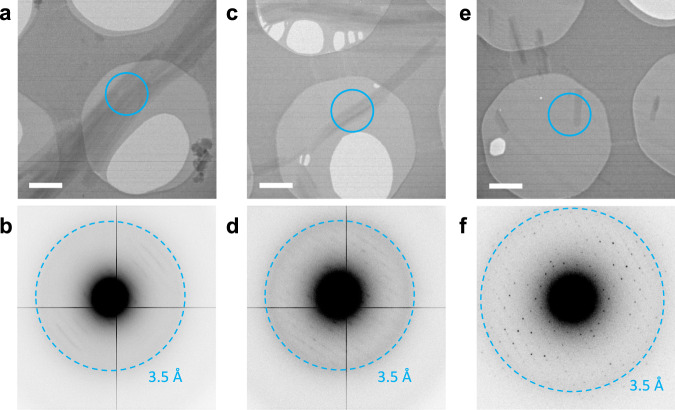
Fig. 2. MicroED data collection from MyD88TIR microcrystals.
a, b Electron micrograph of aggregated microcrystals, only showing poor-quality diffraction data. Scale bar, 1 µm. c, d Multiple microcrystals are overlapping, showing multiple lattices in their corresponding diffraction patterns, complicating data indexing. Scale bar, 1 µm. e, f Single hydrated microcrystal, showing high-quality diffraction data up to 3.0 Å resolution. Scale bar, 1 µm. The cyan rings on the micrographs indicate the 1.5 μm diameter parallel beam, defined by the selected area aperture, used for MicroED data collection. Electron diffraction patterns were collected with an angular increment of 0.68° per frame, at a dose rate of 0.12 e−/Å2 per frame. The data in a–f are representative of three EM grids prepared using 3 µl of a 1 : 50 MALTIR : MyD88TIR crystal solution.

