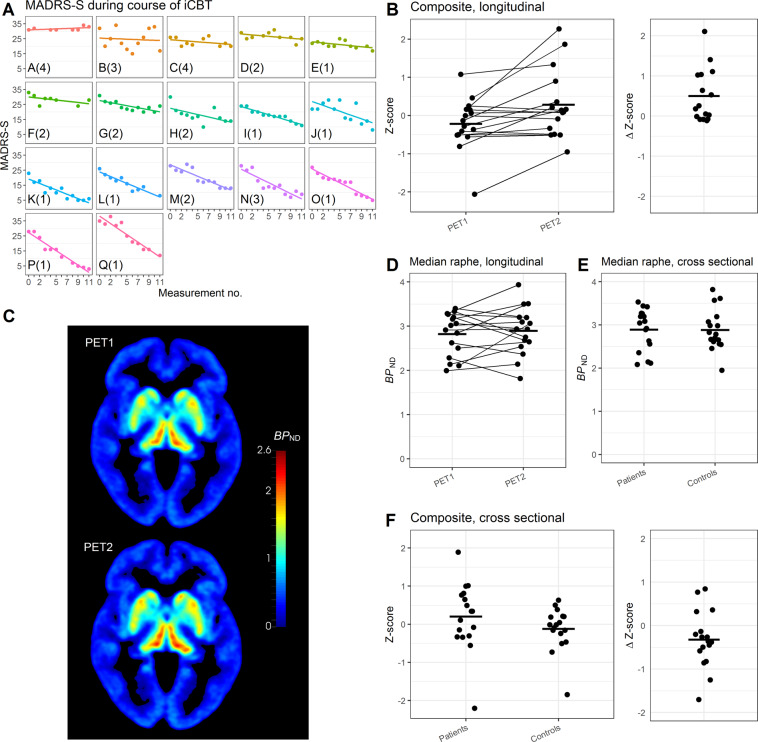
Fig. 3. MADRS-S and PET data.
In A MADRS-S measurements during the course of ICBT. Each cell represents one patient, (n = 17), letters in lower left corner corresponds to the letters in Fig. 1, numbers in parenthesis is CGI-I. In B longitudinal [11C]MADAM data (n = 16) for the composite region, PET1 (baseline) and PET2 (after treatment). Right panel shows difference scores between scans. In C mean parametric image of patients at baseline (upper image) and after treatment (lower image; n = 16), see Supplement 3 for a 3D movie of the same data. In D longitudinal data, median raphe, BPND at PET1 (baseline, left) and PET2 (after treatment, right). In E cross-sectional data, median raphe, BPND for patients with MDD at baseline (left) and healthy controls (right). In F cross-sectional [11C]MADAM data (n = 17 + 17) for the composite region, comparing patients with MDD at baseline to matched healthy controls. Right panel shows difference scores between matched pairs.

