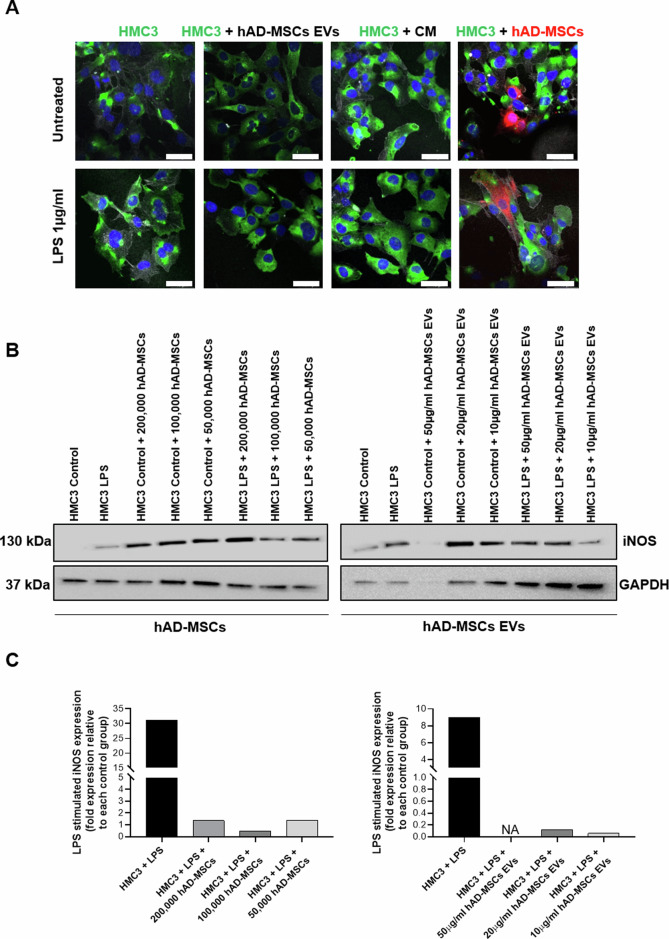
Fig. 4. Effect of hAD-MSCs and hAD-MSC EVs on the immunoinflammatory phenotype of microglia.
A Representative immunofluorescence images with staining for M1 marker CD11b (green), F-actin phalloidin (white), nuclei with DAPI (blue), and hAD-MSCs labeled with CellBrite (red). Scale bar = 49µm. B Western blots showing the protein expression of inducible nitric oxide (iNOS) and GAPDH in control and stimulated (with LPS) conditions when HMC3 cells were co-cultured alone or with hAD-MSCs or hAD-MSCs EVs. C Quantification of the Western Blot bands shown above. NA indicates a not applicable value due to limited signal detection for GAPDH.

