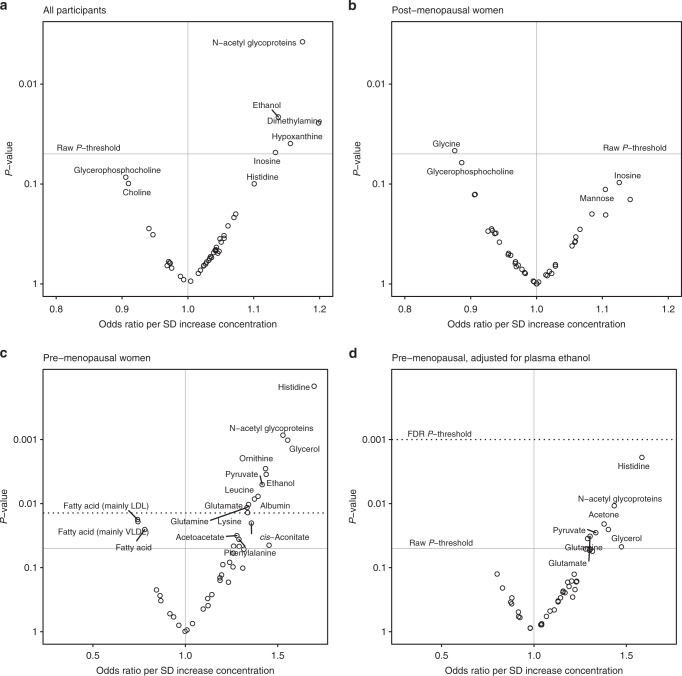
Fig. 2. Odds ratios versus P-values (‘smile plots’) for metabolite univariate risk models by subgroup.
a All study participants. b Post-menopausal women only. c Pre-menopausal women only. d Pre-menopausal women only and adjusted for plasma ethanol concentration. Raw P-values corresponding to FDR P-value thresholds could not be determined for (a, b). Models were adjusted for sample waiting time before plasma fractionation, BMI, diabetes status, waist-to-hip ratio, storage time, blood pressure, daily alcohol intake and duration of use of menopause hormonal treatments at blood collection. Five case–control pairs not matched on menopausal status were excluded from the analysis.

