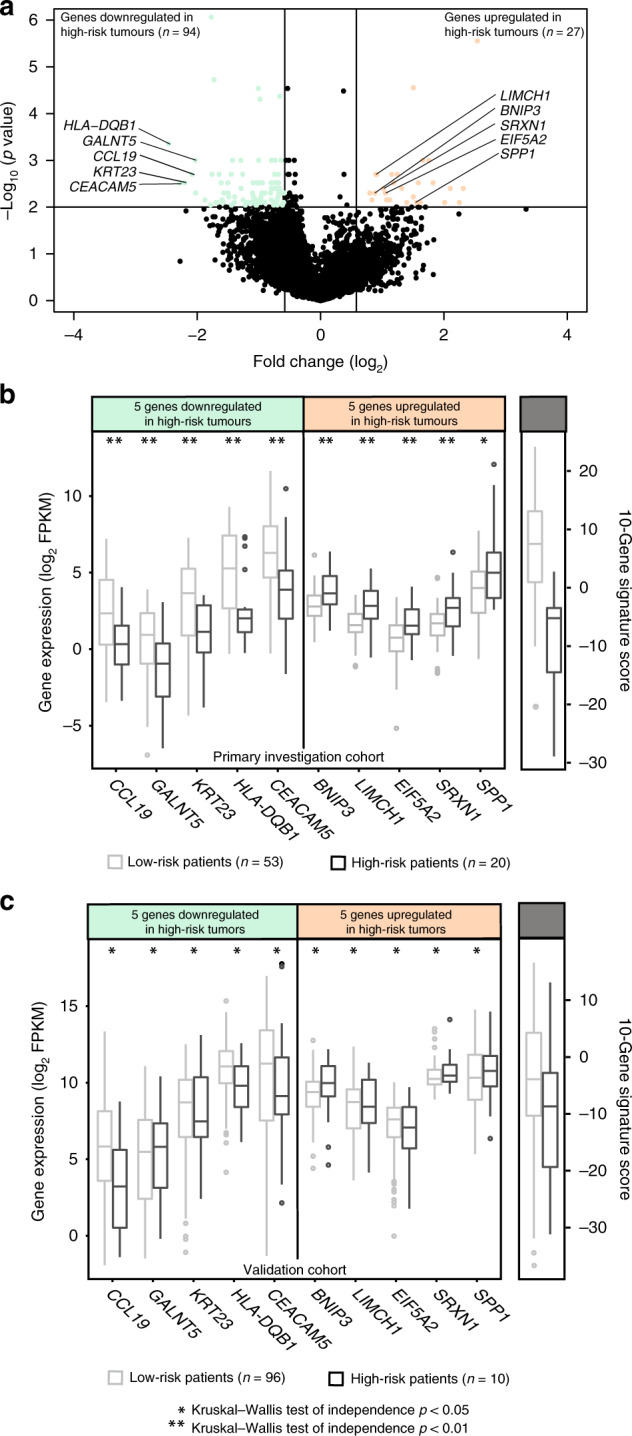
Fig. 1. Identification of a prognostic signature.

a Distribution of differentially expressed genes as defined by the criteria of p < 0.01 and fold change <−1.5 or >1.5. b Distribution of log 2 FPKM expression levels of the ten signature genes and the signature score in the primary investigation cohort and c the validation cohort relative to risk group. Expression values in the non-recurrent tumours are indicated by light coloured boxes and expression levels in recurrent tumours are indicated by dark coloured boxes. Symbols asterisk (*) and double asterisk (**) denote Kruskal–Wallis tests of independence of p < 0.05 and p < 0.01, respectively.
