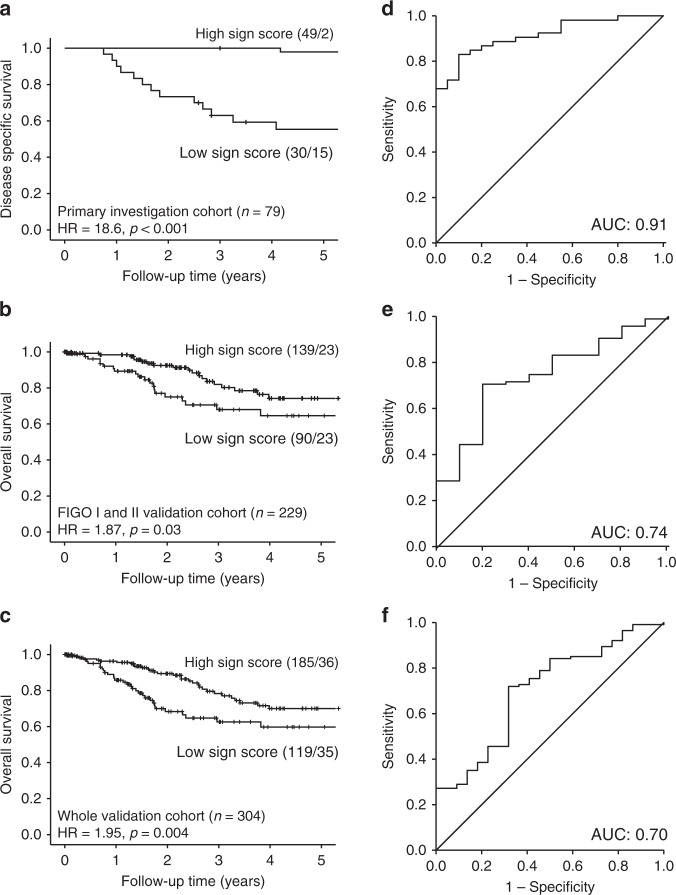
Fig. 2. Prognostic impact of the 10-gene signature.
a Disease-specific survival relative to signature score in the primary investigation cohort. b Overall survival relative to signature score in the FIGO I and II validation cohort. c Overall survival relative to signature score in the whole validation cohort. a–c Kaplan–Meier survival curves are presented with probability values for Mantel–Cox log-rank test that compares categories. The number of patients and events are given within parentheses (patients/events). d–f ROC curves are displayed to reflect the sensitivity and specificity of the gene signature to predict risk group in the primary investigation cohort (d), the FIGO I and II validation cohort (e) and the whole validation cohort (f).

