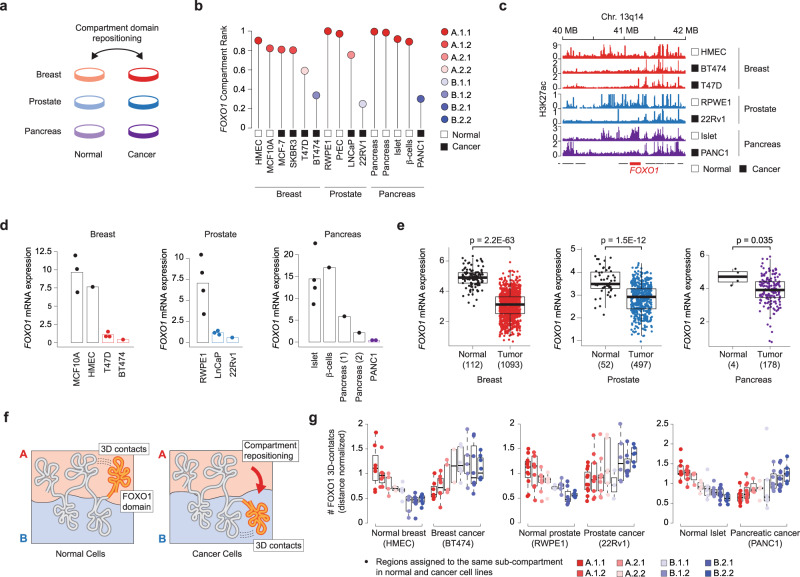
Fig. 4. Subcompartment repositioning between normal and cancer cell lines.
a Schematic comparison of the comparison between normal and cancer cell lines from breast (red), prostate (blue), and pancreas (purple) tissues. b Compartment (color coded) and domain rank (Y-axis) of the FOXO1-containing domain in normal and cancer cells. c H3K27ac intensity at the FOXO1 locus for normal and cancer cell lines derived from breast (red), prostate (blue), and pancreatic (purple) tissues. d, e FOXO1 mRNA expression level (log2-transformed FPKM normalized RNA-seq reads) in either the cell lines with matching Hi-C data (d), or in normal and cancer samples profiled by The Cancer Genome Atlas (TCGA) (e). Each data point represents a replicate in (d, n = 3, 1, 3, 1–4, 3, 1–4, 1, 1, 1, 2) and a sample in (e, numbers of samples in brackets). f Schematic representation of interdomain interactions (dashed lines) between the FOXO1-containing compartment domain (yellow) and regions that do not change compartment in normal and cancer cells (gray). The FOXO1-domain is repositioned in cancer cells. g Distance normalized contact values between FOXO1 and regions that do not change compartment in the compared breast (left, n = 7, 7, 4, 2, 5, 5, 7, 8), prostate (center, n = 11, 10, 9, 6, 3, 6, 7, 6), and pancreatic (right, n = 9, 12, 4, 5, 6, 8, 16, 6) cell lines. The bounds of the box in the plot are first quartile (Q1) and third quartile (Q3). The lower and upper whiskers are computed by extending the box bounds by 1.5*IQR, where IQR = Q3 − Q1.

