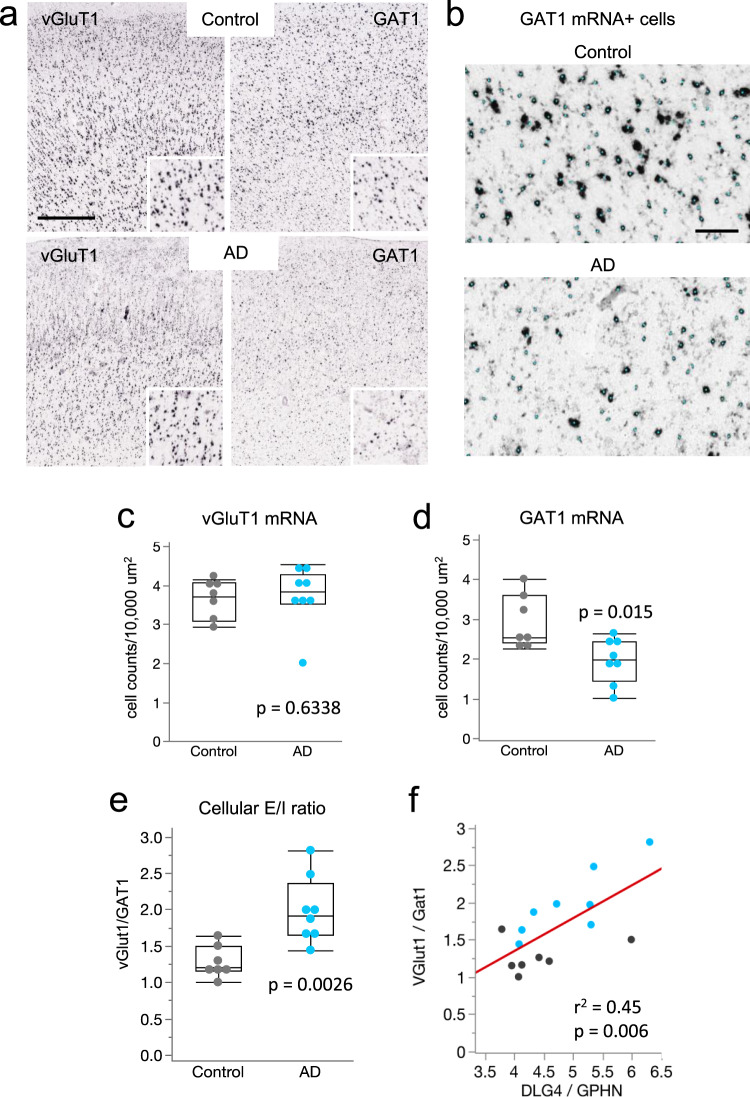
Fig. 7. Marked reductions in GAT1 mRNA expressing cells in AD cases with dementia.
a Images showing colorimetric in situ hybridization for vGluT1 and GAT1 mRNAs in a control no dementia-CERAD 0 case and a dementia-CERAD 3 AD case. Insets show labeled cells at higher magnification. Calibration bar, 750 μm; 375 μm for inset. b Images showing examples of GAT1 mRNA positive (+) cells that were identified and counted in the analyses; identified cells are overlaid with a small cyan dot. Calibration bar, 100 μm c,d Quantification of vGluT1 and GAT1 mRNA expressing cells in parietal cortex per 10,000 μm2 (plots show median values, 25th, and 75th percentiles, and minimum and maximum range). Data shown are based on a 10 µm2 size threshold: separate analyses using 30 µm2 size threshold yielded similar differences in E/I ratios between groups (Supplementary Fig. S5). GAT1 expressing cells were reduced in the AD dementia-CERAD 3 group (n = 8 AD subjects) versus the control, no dementia-CERAD 0 group (n = 7 healthy controls). P values are from the two-sided Wilcoxon Test. e vGluT1/GAT1 ratios for the same subjects; individual vGluT1 to GAT1 comparisons are presented in Supplementary Fig. S5. The cellular E/I ratio was significantly elevated in the AD group versus controls (**P < 0.01 two-sided Wilcoxon test; n = 7 controls, 8 AD). f Linear correlation between the cellular (vGluT1/GAT1) and transcriptional (DGL4/GPHN) expression E/I ratios for cases with both data sets (see Supplementary Data 6); AD (n = 8) cases, cyan; control cases (n = 7), black.

