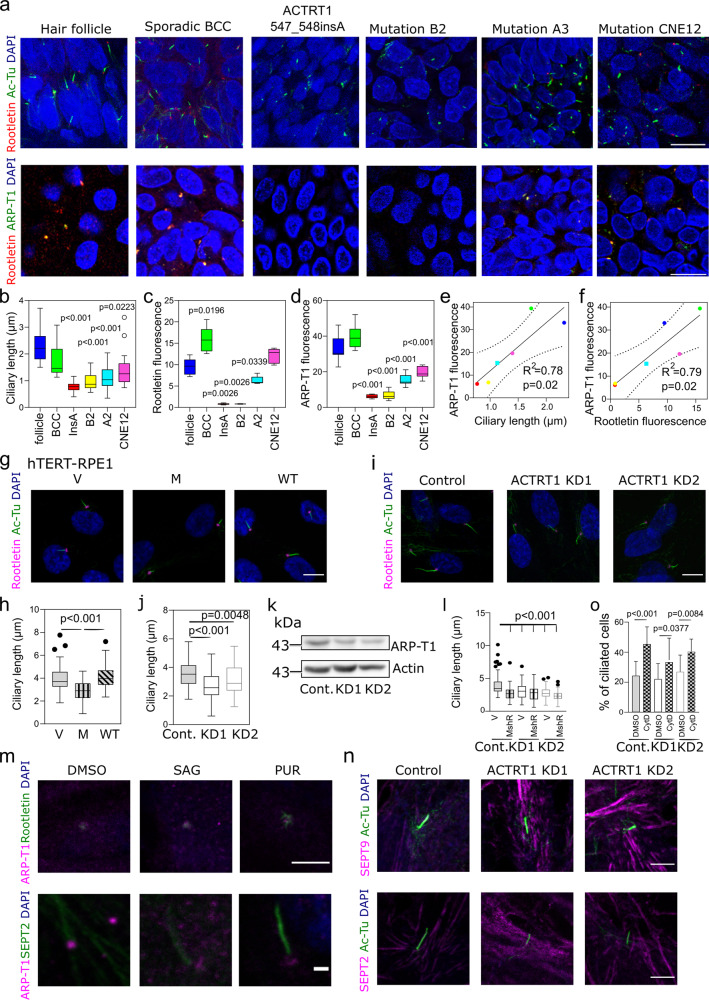
Fig. 4. The Bazex–Dupré–Christol syndrome is a ciliopathy caused by ARP-T1 loss of function, and knockdown of ACTRT1 in hTERT-RPE1 cells induces resorption of primary cilia.
a Representative immunofluorescence images using acetylated-tubulin (green) and rootletin (red) (top), and ARP-T1 (green) and rootletin (red) (bottom) in hair follicle, sporadic BCC and 4 BDCS (ACTRT1 547_548insA, mutation B2, mutation A3, mutation CNE126). Cell nuclei are stained with DAPI (blue). Scale bar, 5 µm. b Quantification of the ciliary length from 3D confocal immunofluorescence microscopy images. c, d Quantification of the relative fluorescence intensity of rootletin (c N = 5) and ARP-T1 (d N = 10) on the ciliary rootlet. e, f Correlation between the ARP-T1 fluorescence and ciliary length (e), and between the ARP-T1 and rootletin fluorescence (f). g Immunofluorescence stainings of acetylated-tubulin (green) and rootletin (pink) in 48 h serum starved hTERT-RPE1 cells expressing an empty vector (V), or ACTRT1 mutant (M), or ACTRT1 WT (WT). Cell nuclei are stained with DAPI (blue). Scale bar, 10 µm. h Quantification of ciliary length of (g). i Immunofluorescence stainings of acetylated-tubulin (green) and rootletin (pink) in 48 h serum-starved control and ACTRT1 KD hTERT-RPE1 cells. Cell nuclei are stained with DAPI (blue). Scale bar, 10 µm. j, k Quantification of the ciliary length (j) and ARP-T1 protein level (k N = 3) in control (Cont.) and ACTRT1 KD hTERT-RPE1 cells. l Quantification of ciliary length in 48 h serum-starved control and ACTRT1 KD hTERT-RPE1 cells expressing an empty vector (V), or ACTRT1 mutant resistant to shRNA (MshR). b–d, h, j, l Results are presented as Tukey box-plot. Black circles represent outliers. m Representative immunofluorescence stainings of ARP-T1 (pink) and rootletin (green, top) or septin 2 (green, bottom) upon treatment with SAG or purmorphamine (PUR) in hTERT-RPE1 cells under differentiating condition. Scale bar, 5 µm (top) or 1 µm (bottom). n Immunofluorescence stainings of acetylated-tubulin (green) and septin 9 (pink, top) or septin 2 (pink, bottom) in 48 h serum-starved control and ACTRT1 KD hTERT-RPE1 cells. Scale bar, 1 µm. o Percentage of ciliated control and ACTRT1 KD hTERT-RPE1 cells under proliferative condition, after treatment with cytochalasin D (CytD). Data are presented as means of the percentage ± SD.

