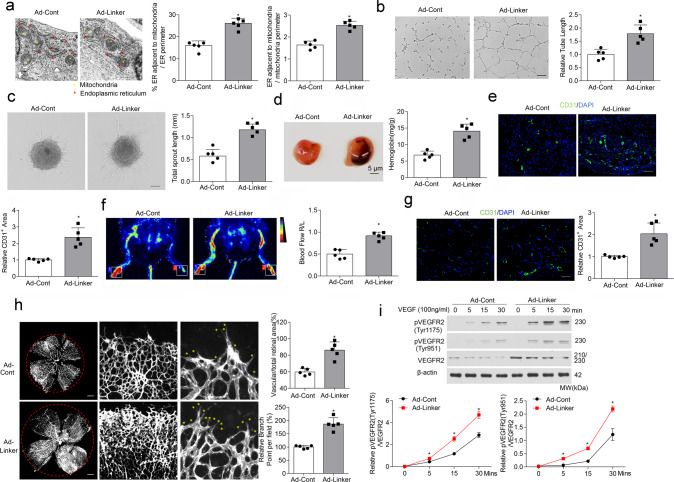
Fig. 3. MAM induction enhances angiogenesis in vitro and in vivo.
HUVECs were infected for 24 h with adenovirus encoding control (Ad-Cont) or mitochondria–endoplasmic reticulum (ER) linker (Ad-Linker) (n = 5 independent experiments). a Representative transmission electron microscopy images of ER and mitochondrial morphology. Bar graph illustrating quantitation of ER length adjacent to mitochondria normalized by total ER length and by mitochondrial perimeter (n = 5 independent experiments). b Representative images of tube formation. (n = 5 independent experiments). Scale bar, 100 µm. Tube length/field in 10 random microscopic fields per group was measured by NIH ImageJ and statistically analyzed. c Representative images of spheroid-sprouting. (n = 5 independent experiments). Scale bar, 100 µm. Sprout length in 10 random microscopic fields per group was measured by NIH ImageJ and statistically analyzed. d Matrigel containing vascular endothelial growth factor (VEGF) was injected subcutaneously into 6-week-old mice that been injected intravenously with adenoviruses coding control (Ad-Cont) or mitochondria–ER linker (Ad-Linker) 24 h before. After 10 days, matrigel plugs were removed for analysis of new vessel formation by histological examination and hemoglobin (Hb) assay (n = 5 mice/group). Bar graph illustrating quantification of Hb extracted from matrigel plugs of different groups. e Anti-CD31 immunostaining of matrigel plugs from different groups. (n = 5 mice/group). Scale bar, 100 µm. Bar graph showing quantification of relative CD31-positive area (fold of control). f Representative images showing blood flow reperfusion monitored by laser Doppler ultrasound on day 10 after ischemic injury. The ratio of ischemic/non-ischemic perfusion was quantitatively analyzed (n = 5 mice/group). g Representative images showing CD31 immunostaining in the gastrocnemius muscle on day 10 after artery ligation. (n = 5 mice/group). Scale bar, 100 µm. h Representative confocal images of a P5 retina lobe stained with IsoB4 showing a higher number of sprouts (yellow stars) at the vascular front of Ad-Linker infected retinas, compared with Ad-Cont infected retinas. (n = 5 mice/group). Scale bars, 500 mm. i Western blot analysis of phosphorylation of VEGFR2 at Try 1175 and Try 951 (n = 4 independent experiments). Statistical significance was assessed using two-tailed t-tests to compare two groups. *p < 0.05 vs Ad-Cont. All values are mean ± S.D.

