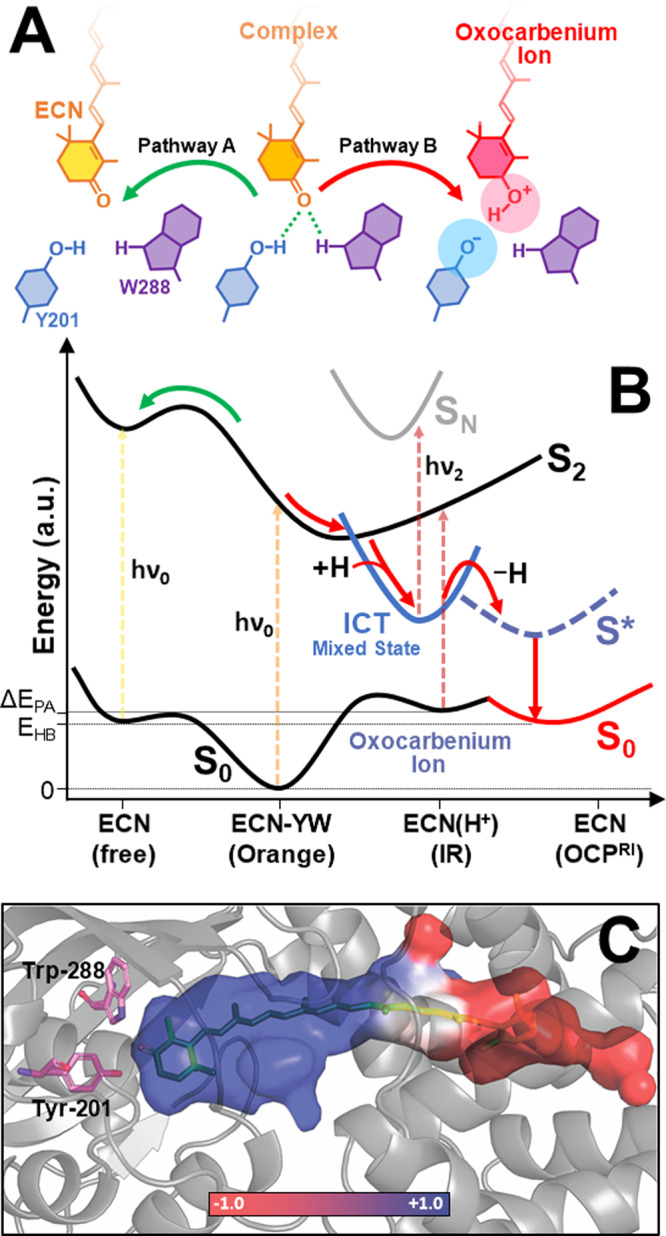
Fig. 4. Proposed pathways of the hydrogen bond breakage in OCP.

A Schematic configuration of ECN complexes with the conserved tyrosine (blue) and tryptophan (violet) residues. B Proposed scheme for the evolution of carotenoid excited electronic states in OCP. Green and red arrows show energy transitions in the system following coordinate A and B, respectively. The length of the dashed arrows shows the energy of light quanta absorbed in different states. C Distribution of the local electric field in the carotenoid-binding pocket of OCP in pseudo colors. To estimate the charge distribution in OCP, we used the PDB ID 3MG1 structure model with augmented hydrogen atoms and parameterized it with a partial charge formalism using CHARMM force field. Visualization of the electrostatic potential on the surface of the protein’s inner cavity was done with the apbs.tools plugin for PyMol. For more details see Supplementary Fig. 5 and its legend.
