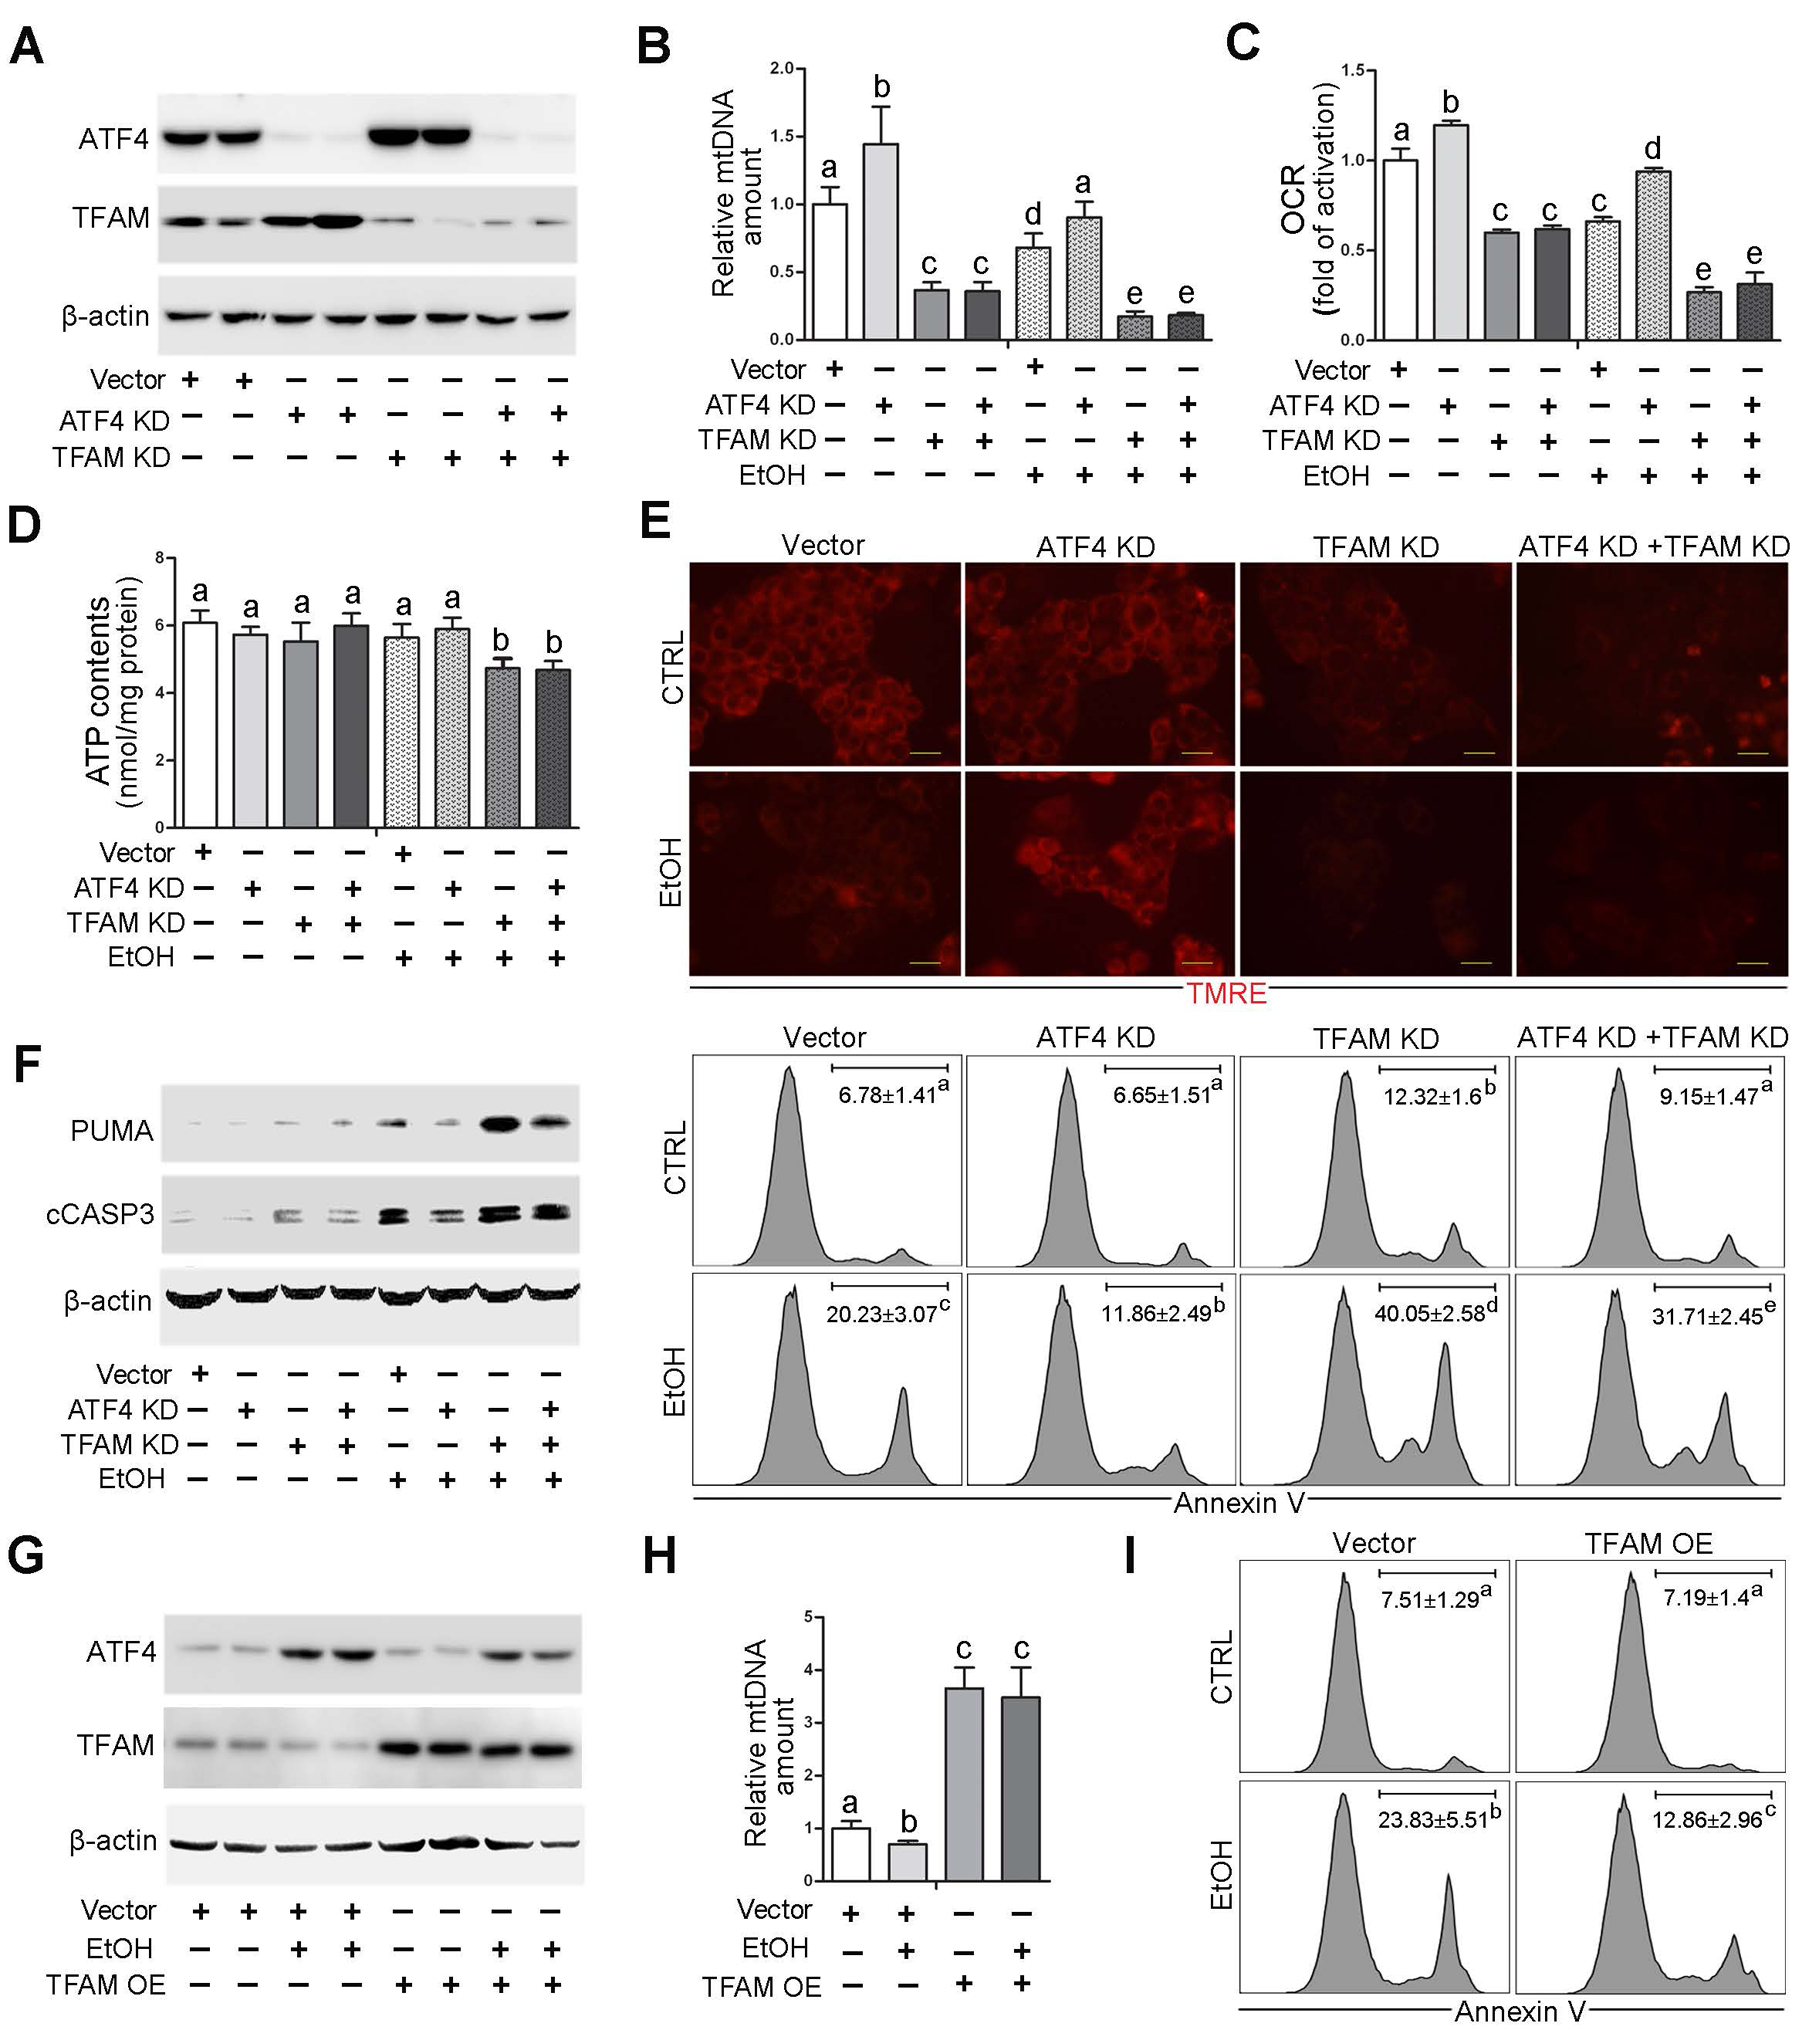
Fig. 4. TFAM reduction is involved in ATF4-mediated mitochondrial dysfunction in VL-17A cells with alcohol exposure.

ATF4 knockdown, TFAM knockdown, ATF4/TFAM double knockdown VL-17A cells were generated and treated with 100 mM ethanol for 72 hours. (A) Western blot analysis of ATF4 and TFAM. (B) mtDNA levels (MTND1) relative to nuclear DNA (SDHA) in VL-17A cells (n=5). (C) Basal oxygen consumption rate of VL-17A cells (n=6). (D) ATP contents in VL-17A cells (n=5). (E) Immunofluorescent staining of mitochondrial membrane potential using TMRE probe. Scale bars: 20 μm. (F) Western blot analysis of PUMA and cleaved caspase-3, and FACS analysis of apoptotic cell death represented by Annexin V positive cells (n=4–6). (G-I) VL-17 cells were transfected with TFAM overexpression CRISPR plasmids and treated with 100 mM ethanol for 72 hours. (G) Western blot analysis of ATF4 and TFAM in VL-17A cells. (H) mtDNA levels (MTND1) relative to nuclear DNA (SDHA) in TFAM overexpression cells (n=5). (I) FACS analysis of apoptotic cell death represented by Annexin V positive cells. Protein bands intensity was quantified by ImageJ (NIH). Data are presented as means ± SD. Statistical comparisons were made using one-way ANOVA with Tukey’s post hoc test. Bars with different characters differ significantly (P < 0.05). EtOH, ethyl alcohol.
