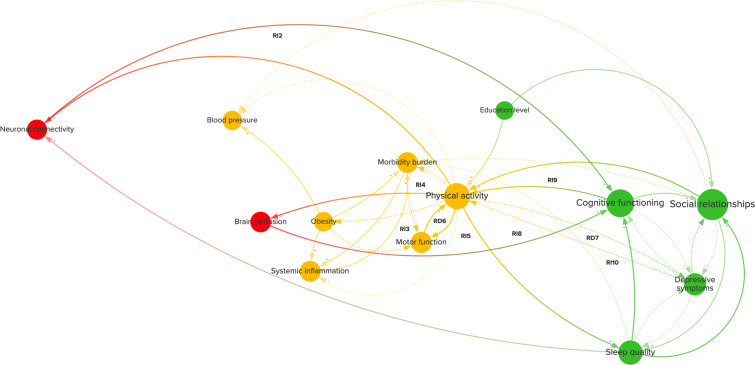
Fig. 4.
Feedback loops (from Fig. 1) that include physical activity. This diagram shows the variables, causal connections, and reinforcing direct (RD6–7) and indirect (RI2–5, RI8–10) feedback loops related to physical activity. The diagram is divided into variables related to brain health (red), physical health (yellow), and psychosocial health (green). A positive connection (+, solid line) represents an effect in the same direction, whereas a negative connection (-, dotted line) represents an effect in the opposite direction

