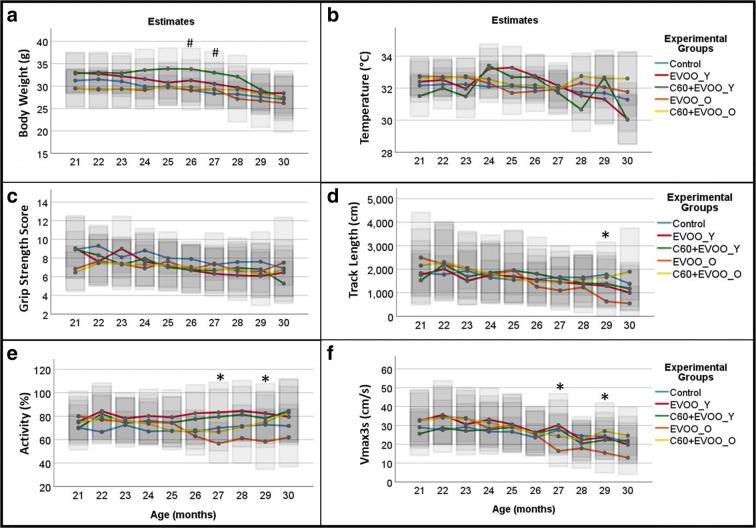
Fig. 5.
Health span assessment in C57BL/6 J. Graphical presentation of age-related changes of body weight (panel a), surface temperature (panel b), grip strength score (panel c) as well as of three parameters obtained from a 5-min locomotor activity test [track length (panel d), activity (panel e) and max speed kept for 3 s (Vmax3s, panel f)] in C57BL/6 J mice. C60 + EVOO_Y and EVOO_Y represent the groups of mice starting the treatment with C60-EVOO or EVOO, respectively, at the age of 9 months. C60 + EVOO_O and EVOO_O represent the groups of mice starting the treatment with C60-EVOO or EVOO, respectively, at the age of 23 months. The graphs are plotted using the mean estimates obtained by linear mixed models using age (months) as categorical (ordinal) variable, sex (categorical), experimental group (categorical) and the interaction between age and experimental groups. Transparent grey intervals overlaid with the means represents 95% confidence interval. Pairwise comparisons (sequential Bonferroni) are shown only for those experimental groups displaying significant changes from controls also in linear mixed model using age as continuous variables. # p < 005 for C60 + EVOO_Y compared to controls. * p < 0.05 for EVOO_O compared to controls. Comparison of health span data starts at 21 months of age. Respective numbers of mice at 21 months are as follows: Controls n = 24 (12 F, 12 M); EVOO_Y n = 8 (4 F, 4 M); C60-EVOO_Y n = 8 (3 F, 5 M); EVOO_O n = 9 (5F, 4 M); C60-EVOO_O n = 10 (5F, 5 M). Since the number of mice decreases with aging due to age-related mortality, a detailed description of the sample size is reported in Supplementary table 2

