
Fig. 2.
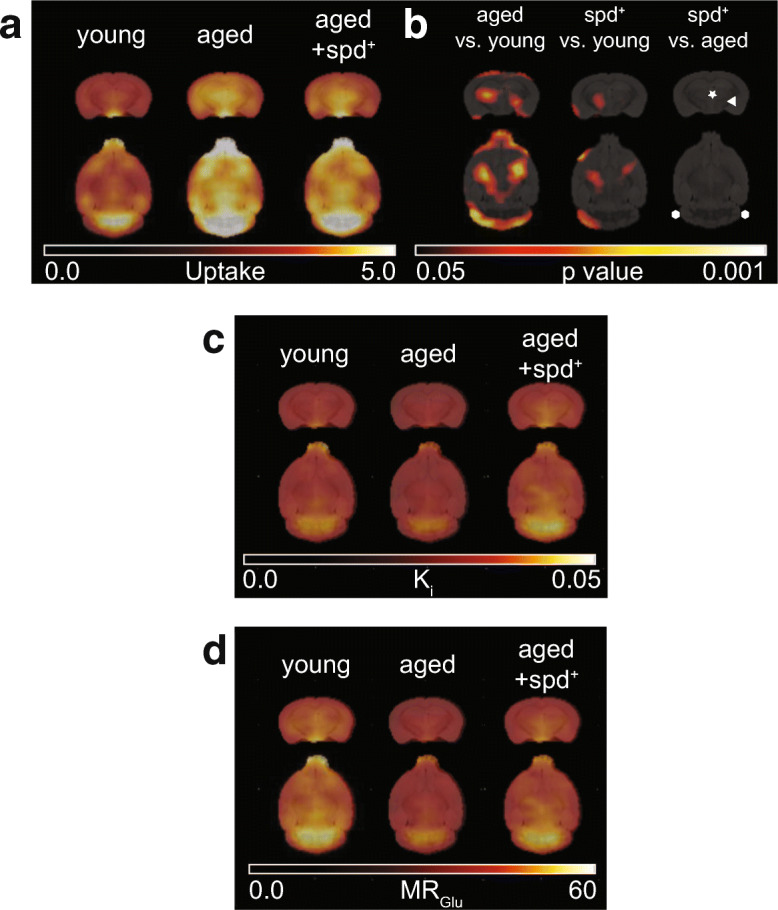
Coronal and horizontal average [18F]FDG PET parametric brain images of a [18F]FDG uptake ([%ID/cc]), c influx rate constant Ki [ml/g/min] and d glucose metabolic rate MRGlu [μmol/min/100 g] calculated using Patlak graphical analysis in 6 month old (young) and in 23 month old untreated (aged) or spermidine-treated (aged +spd+) mice. b Results of voxel-based statistical parametric mapping of [18F]FDG uptake (unpaired 2-sample t test) identifying differences between young, aged and aged spd+ mice. The caudate putamen is indicated by a white arrowhead, thalamic regions by an asterisk. Cerebellum is flanked by two white hexagons. Threshold has been set to show only statistically significant voxels (p < 0.05; minimum cluster size of 50 voxels). Increases are indicated as hot scale. Additional data are presented in Supplementary Fig. S1