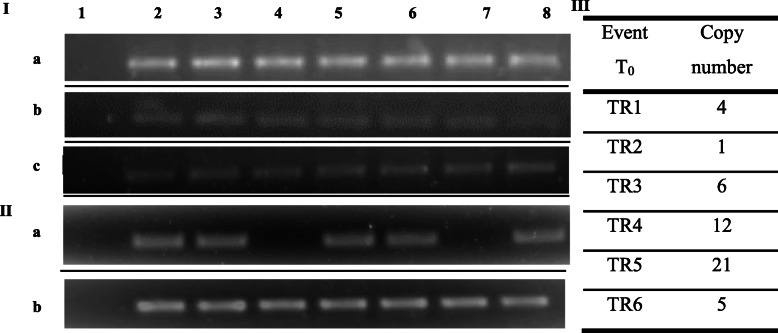
Fig. 2.
Molecular analysis of transgenic wheat plants. I Analysis by PCR of the IPT gene (a), BAR gene (b), and GHS gene (c). Lane 1, negative control; lane 2, positive control; lanes 3–8, six independent putative transgenic plants; all plants had the amplified gene as expected. II Analysis by RT-PCR of the BAR gene (a) and GHS gene (b). Lane 1, negative control; lane 2, positive control; lanes 3–8, six independent putative transgenic plants. III Southern blot analysis on T1 plants derived from transgenic events, indicating the number of copies of each transgenic event

