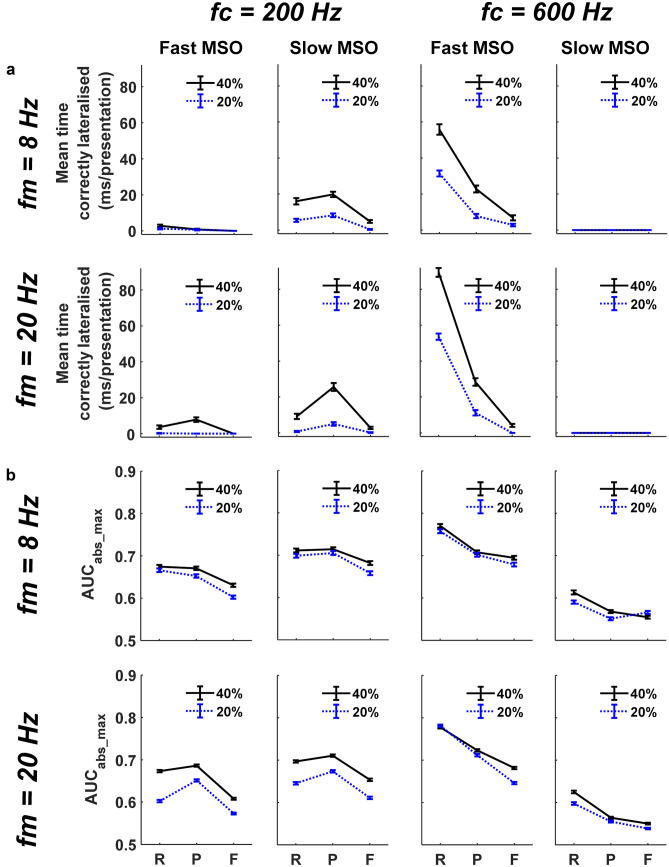
Fig. 8.
MODEL 2: summarising correct lateralisations of SAM stimuli, comparing between: fast and slow MSOs; carrier frequencies (fc) of 200 and 600 Hz; modulation rates (fm) of 8 and 20 Hz; and ITDs inserted into either 20% (blue dotted lines) or 40% (black solid lines) of the AM cycle during rising (R), peak (P), or falling (F) energy. (a) Mean (± SEM) time correctly lateralised per presentation (number of correct lateralisations × bin duration/25 presentations). (b) Peak absolute lateralisation performance, calculated as a AUCabs_max (± SEM)

