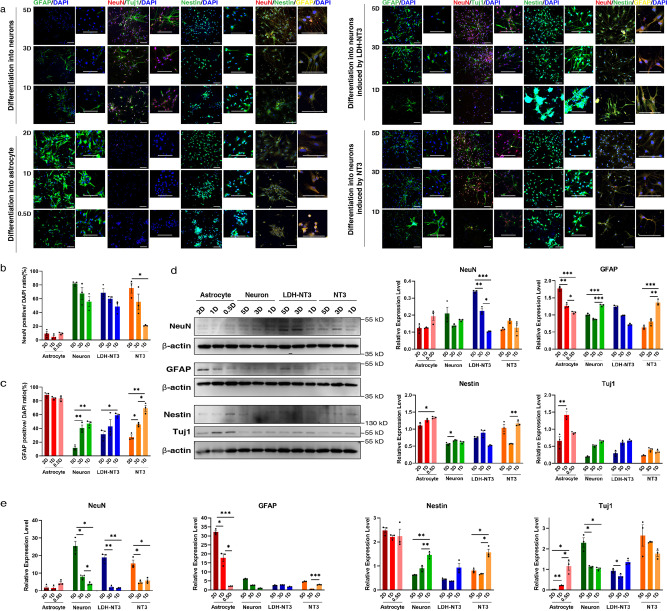
Fig. 2. Differentiation efficiency of training and testing sets identified by immunofluorescence, western blot and RT-qPCR.
a Images of immunofluorescent staining using NeuN, GFAP, Tuj1 and Nestin as characteristic markers of neuron and astrocyte differentiation induction at 5D (5 days), 3D (3 days), 2D (2 days), 1D (1 day) and 0.5D (0.5 days). Differentiated cells treated with NT3 and LDH-NT3 were stained following the same protocols. Quantification of immunostaining data. The y-axis shows the number of: b NeuN- and c GFAP-positive cells, n = 3 imaging field repeats. d Western blot analysis of NeuN, GFAP, Nestin and Tuj1 protein in NSCs in different states of differentiation, n = 3 biological repeats. e Quantitative real-time PCR detection of NeuN, GFAP, Nestin and Tuj1 gene expression in cells in different states of differentiation, n = 3 biological repeats. Data are shown as mean ± SEM. Statistical significance was determined by two-sided Welch’s ANOVA. *p < 0.05, **p < 0.01, ***p < 0.001. Scale bar = 100 μm. LDH: layered double hydroxide.

