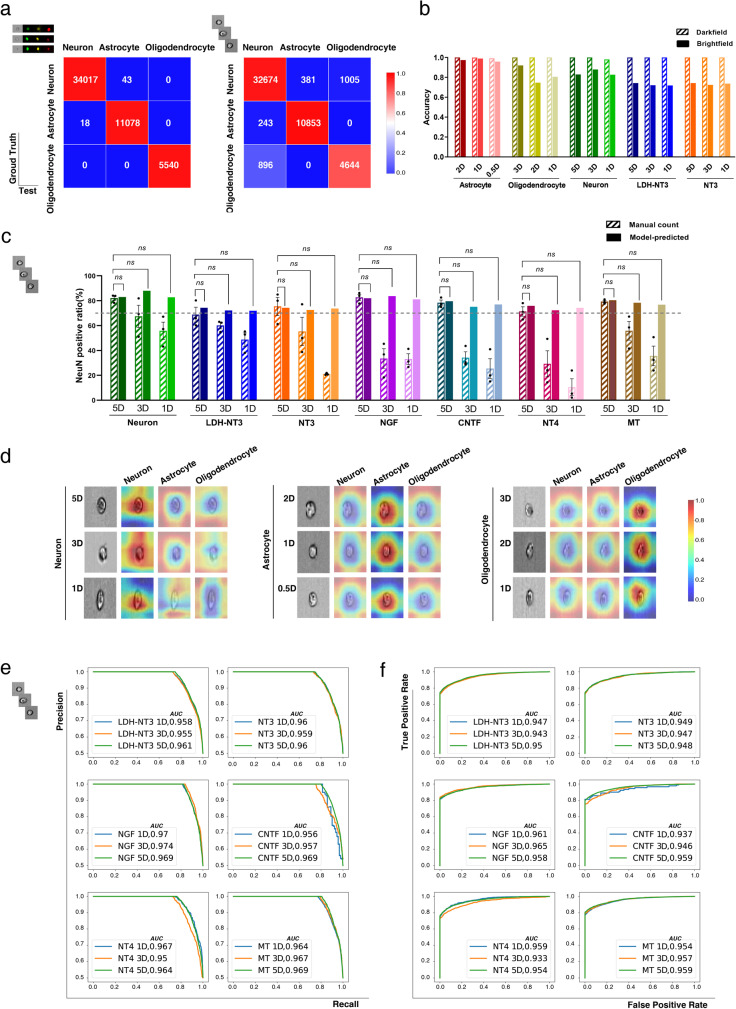
Fig. 4. Deep learning prospectively identifies the differentiation of NSCs at 5D (5 days), 3D (3 days), 2D (2 days), 1D (1 day) and 0.5D (0.5 days).
a Confusion matrices for the darkfield (left) and brightfield (right) models for the classification of each differentiated cell type. b Accuracy of each training set and the independent LDH-NT3 test set in both darkfield and brightfield models, the size of each testing dataset is available in Source Data file. c The proportion of neurons calculated by immunofluorescence and brightfield-based model benchmark, the size of each testing dataset is available in Source Data file. Data are shown as mean ± SEM, statistical significance was determined by two-sided single population t-test. ns: not significant. d The CAM highlights the class-specific discriminative regions of cells, blue represents low attention while red represents high attention. Benchmarking differentiated cell type predictions on independent testing data with: e ROC (receiver operating characteristic) and f PR (precision-recall) curves. LDH: layered double hydroxide.

