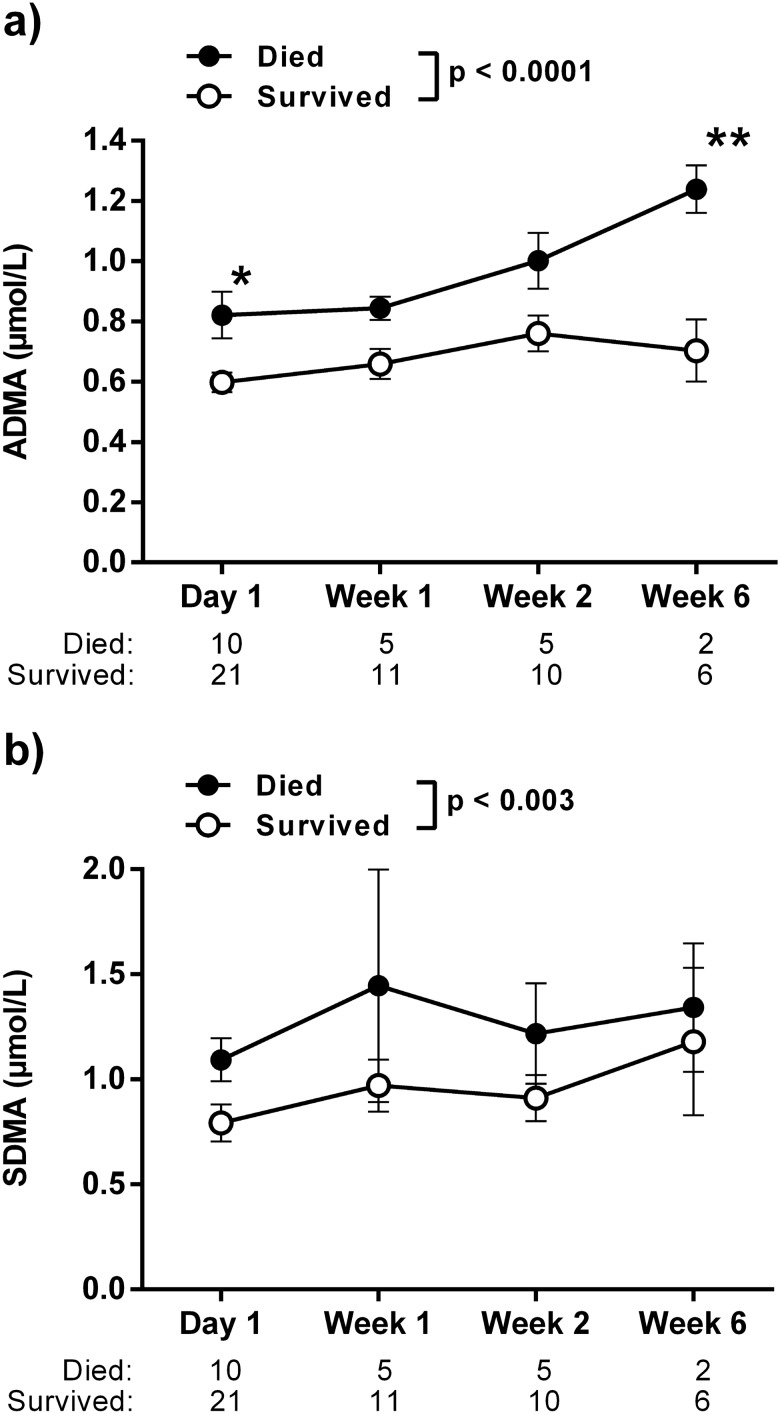
Figure 2.
Time course of ADMA (a) and SDMA (b) serum concentrations of hospitalized COVID-19 patients during in-hospital treatment. N refers to the number of patients for whom blood samples were available for analysis at each time point. P values given in the legend refer to two-sided ANOVA for trend between groups; asterisk mark statistically significant differences between both group at a specific time point in Bonferroni’s multiple comparisons test. *p < 0.05, **p < 0.01 between groups.

