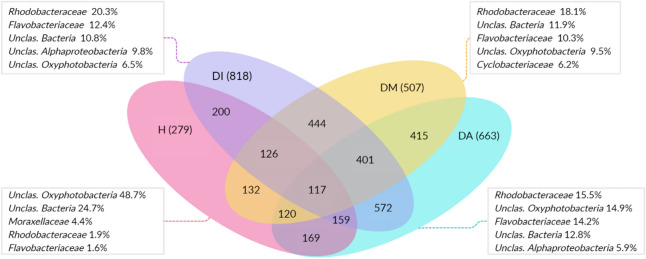
Figure 4.
Venn diagram showing the microbiota (OTUs) of each analyzed stage, of which pink represents healthy colonies (H), purple initial necrosis stage (DI), yellow for colonies in the intermediate necrosis stage (DM), and blue represent colonies in the advanced stage (DA). The numbers of shared OTUs between stages are shown in the intersections. Within the boxes are the five most abundant classifications at the family level for each corresponding group.

