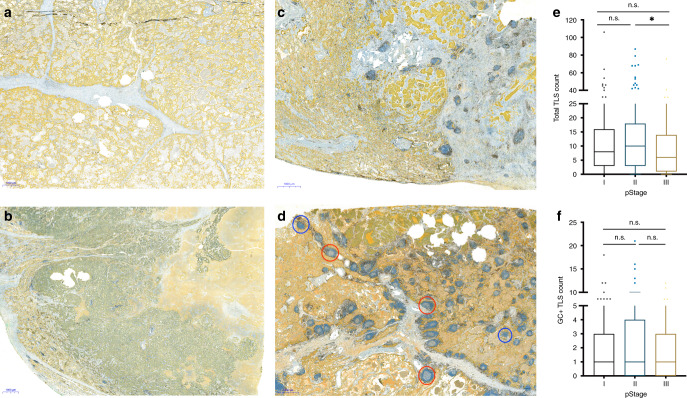
Fig. 1. Distribution of tertiary lymphoid structures (TLS) in tissue and across TNM stages of NSCLC.
a–d Examples of different levels of TLS in resected primary tumours using CD8 (brown)/cytokeratin (CK, yellow) antibodies. Cytotoxic T cells labelled with CD8 and epithelial cells with CK. a No, b low, c moderate and d high TLS based on semi-quantitative model of scoring. TLSs with germinal centres (GC+ TLS, red circle) and without germinal centres (blue circle) are indicated. e, f Box-plots showing the distribution of total TLS (e) and GC+ TLS (f) count across TNM stages (stage I, n = 213; stage II, n = 159; stage III, n = 118) in NSCLC. Statistical analysis was performed with Kruskal–Wallis and Dunn’s multiple comparison tests. n.s. not significant, * adjusted P < 0.05.

