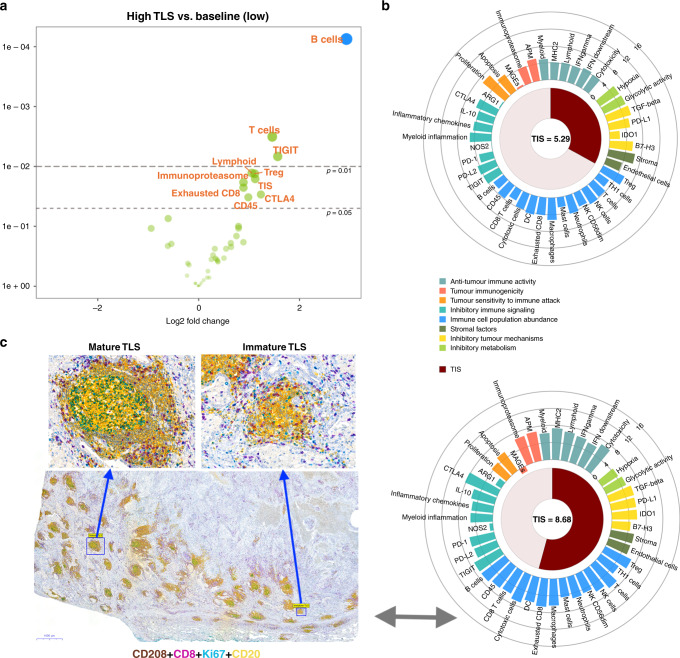
Fig. 2. Relationship between immune gene signatures and tertiary lymphoid structures (TLS).
a Volcano plot of ‘All Signatures’ displays the significance of signature difference between high TLS group vs. baseline, low TLS group. Each dot represents a signature, the x-axis shows the log 2 fold change and the y-axis shows log 2 fold change P values. Adjusted and unadjusted P values are coloured blue and green, respectively. Signatures that have greater statistical significance produced points that are both larger and darker in hue, in addition to appearing higher on the plot. b Examples of low (upper) vs. high (lower) TIS scores corresponding to TLS status. The wheel plot depicts the relative expression of each signature for two samples selected from high and low TLS groups. Signatures are grouped based on the biological process in which they belong, and the TIS score is shown as a radial arc around its numeric score. c The panel represents: first, the tissue landscape with regards to TLS frequency from the same individual case with high TIS score; second, an example of multiplex IHC thath was used for differentiation of morphologically mature (GC+) from immature (GC−) TLSs on 20 samples—in order to validate the scoring model 3. Well-formed TLSs showing CD208+ mature dendritic cells (brown), CD8+ T cells (purple), Ki67+ proliferating cells (teal) and CD20+ B cells (yellow). Germinal centre positivity account for areas with B cells clusters with proliferation activity, as appeared with tertiary green colour. GC+ TLSs were easily differentiated from immature TLSs with very low magnification (×1).

