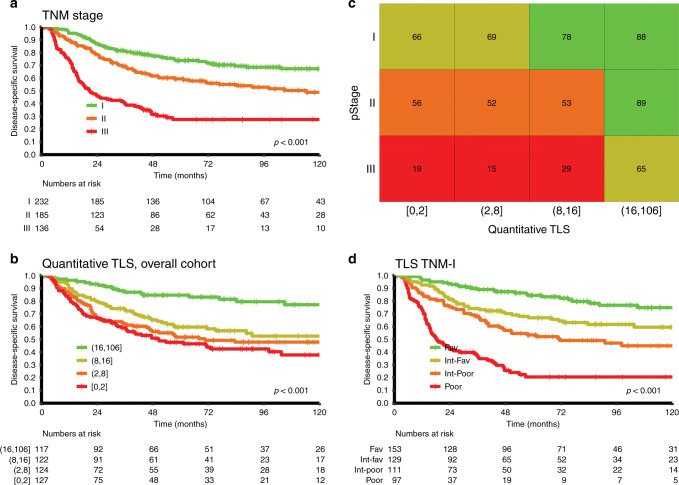
Fig. 4. Inclusion of TLS in NSCLC TNM-Immune cell score (TNM-I) classifier.
a–d Disease-specific survival (DSS) curves of the entire cohort, according to TNM stages (a) and TLS score (from scoring model 2) (b). The combination of A and B results in a TNM-I survival table (c), in which classifying subgroup of patients based on 5-year DSS differences within the same TNM stages. The colour of the squares in the table represent patient subgroups with similar survival (favourable with green, intermediate-favourable with moss green, intermediate-poor with orange and poor prognosis with red). d Kaplan–Meier survival curves of TNM-I classifier illustrating the significant prognostic value of TLS-derived Immune score across each pathological stage.

