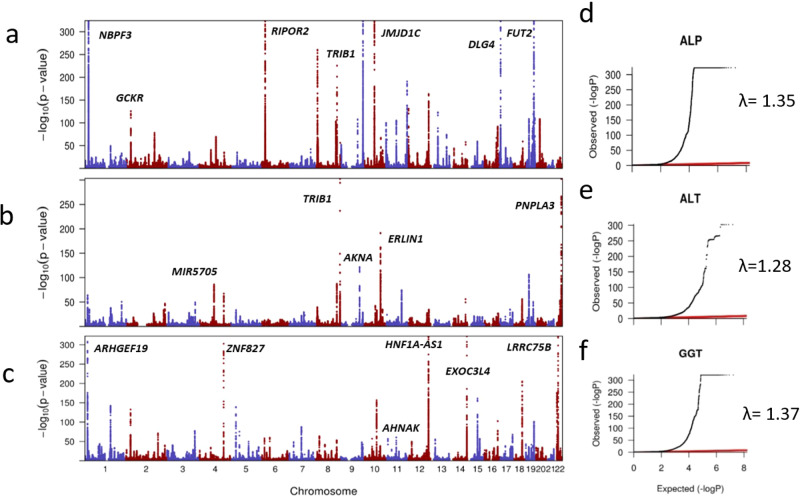
Fig. 2. Overview of ALT, ALP, and GGT loci identified within the UKB study (discovery sample).
Manhattan (MH) plots illustrated have been created based on summary statistics of GWAs on liver enzymes where the x-axis demonstrates chromosome number and the y-axis represents −log 10 (P value) for the association of SNP with liver enzymes. Q–Q plots are illustrated to show the inflation of test statistics using the summary statistics of the liver enzyme GWAS. Where the x-axis represents the expected log (P value). The red line shows the expected results under the null association. Y-axis illustrates the observed log (P value). a MH plot based on ALP GWAS summary statistics. b MH plot based on ALT GWAS summary statistics. c MH plot based on GGT GWAS summary statistics. d Q–Q plots for ALP, e Q–Q plots for ALT, and f Q–Q plots for GGT. Inflation of test statistics was represented by lambda (λ) values.

