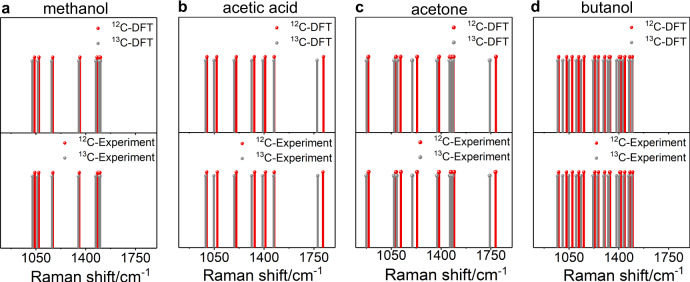
Fig. 3. Isotopological validation of CO2RR origin of surface species.
Spectral barcodes for the DFT-computed Raman spectra (top row) and experimental SERS spectra (bottom row) for 12C (red lines) and 13C (gray lines) isotopologs of a methanol, b acetic acid, c acetone, and d butanol. Each vertical line in a barcode indicates the peak wavenumber of a vibrational mode. The number of SERS spectra that led to the experimental barcodes are a 119 and 43, b 106 and 59, c 243 and 177, and d 1062 and 836 for the 12C and 13C isotopologs, respectively. Source data are provided as a source data file.

