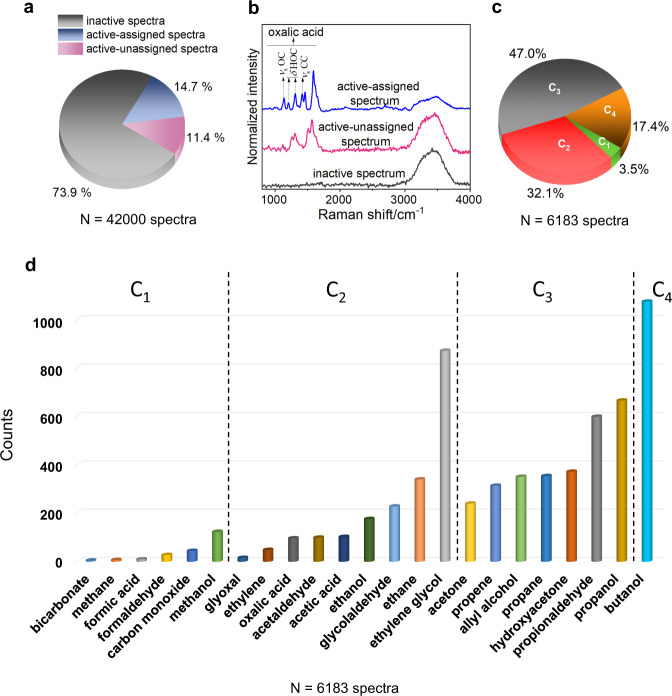
Fig. 4. Profile of surface species observed in CO2RR by in situ nanoscale SERS.
a Pie chart showing the percentage distribution of inactive SERS spectra, active spectra that were assigned to a species in the database, and active spectra that were unassignable. This distribution was obtained by an analysis of 42,000 in situ SERS spectra collected from 40 individual Ag NP scatterers in 12CO2-saturated H2O(1) under plasmonic excitation. b Representative examples of SERS spectra in each of these three classes, plotted in a vertically stacked manner. The broad band at ca. 3400 cm−1 in all three spectra is due to Raman scattering from H2O(1) in the medium. The active, assigned SERS spectrum shown as an example captured oxalic acid, the major vibrational modes of which are labeled by the following symbols: νs—symmetric stretching; δ—bending. SERS spectra were baseline-subtracted, subjected to smoothing by a Savitzky–Golay filter with a window of 5 points and a polynomial of order 3, and normalized to a [0, 1] scale prior to plotting in a vertically stacked manner. The baseline was determined by polynomial fitting. c Pie chart showing the percentages of active, assigned spectra that captured a C1, C2, C3, and C4 species. d Bar plot showing for each surface species the number of detection events across the set of active, assigned spectra. Each species is shown by a bar of a different color. The species are grouped into C1, C2, C3, and C4 categories; within each category, they are listed in the order of their prevalence. N in a, c, and d represents the total number of spectra that led to the plot. Source data are provided as a source data file.

